
Part of the AEO Hub — browse all 28 AEO guides.
A growth lead I talked to in March had a beautiful chart. Their AI share of voice across ChatGPT and Perplexity had climbed from 14% to 38% over two quarters. The GEO agency that produced the chart got a contract renewal on the strength of it. Then the founder asked a question nobody on the call could answer: "great, but did any of that turn into money?" Silence. The agency tracked mentions. Nobody tracked revenue. The 38% was real, and it was also, as far as the P&L was concerned, unfalsifiable.
That gap is the entire subject of this article. AI share of voice is a genuinely useful metric, and I am not here to trash it. I am here to argue that the version everyone reports today, classic mention-count SOV, is an input metric that the industry keeps presenting as an outcome metric, and that the correction, what I call Revenue Share of Voice, is both computable and far more honest. This is the longer, definitional companion to the multi-LLM visibility tracker breakdown; that piece covered how to track citations across the four engines, this one covers what the resulting SOV number actually means and how to make it answer the founder's question.
Quick Facts
| Metric | Value | Source |
|---|---|---|
| Year "share of voice" entered marketing vocabulary | 1960s, mass-media ad-spend era | Kantar / advertising history [1] |
| Classic SOV definition | Your mentions / total category mentions | Nielsen, Kantar SOV literature [2] |
| Binet & Field "excess SOV drives growth" finding | ESOV correlates with market-share gain | IPA / Les Binet research [3] |
| AI SOV trackers reporting some SOV metric (2026) | Profound, SE Ranking, SEOcrawl, Geoptie, Loamly, Otterly | Vendor docs [4][5][6] |
| Citation-to-click conversion (Perplexity, observed) | 8-25% | Attrifast logs + Profound research [4][9] |
| Citation-to-click conversion (ChatGPT, observed) | 5-15% | Attrifast logs [9] |
| Trackers computing Revenue SOV (Stripe-joined) | 0 of the major ones | Vendor docs |
| Minimum prompts for reliable SOV trend | ~50 per engine | Attrifast methodology |
| Recommended samples per prompt | 3-5 | Stochastic-sampling correction |
| AI Overviews trigger rate (US English) | 13-15% of queries | Search Engine Land [7] |
| Brands cited per Perplexity answer (typical) | 4-7 | Perplexity docs [5] |
| Brands cited per Claude web-search answer (typical) | 1-3 | Anthropic docs [11] |
Two of those rows carry most of the argument. The Binet & Field row [3] is the oldest and the most important: decades of advertising research found that brands whose share of voice exceeds their share of market tend to grow, which is why SOV earned its place as a leading indicator. The "0 trackers computing Revenue SOV" row is the gap. The first row tells you SOV matters. The second tells you the version you can buy off the shelf is measuring the wrong half of it.
What "share of voice" actually means: a precise definition
Share of voice is the proportion of total category attention that belongs to your brand, measured against your competitors, over a defined channel and time window. In its original 1960s form, SOV meant your share of total category advertising spend: if the category spent $10M on TV ads and you spent $2M, your SOV was 20%. The premise, validated repeatedly by Nielsen and Kantar and later formalized by Les Binet and Peter Field, was that SOV is a leading indicator of market share. Spend more share than you hold, and you tend to grow into it.
The metric survived every channel transition. In the SEO era, "share of voice" became your share of organic visibility across a keyword set, weighted by search volume and rank-based CTR. In the social era, it became your share of brand mentions across social platforms. In 2026 it became your share of mentions and citations inside AI-generated answers. The channel changed four times; the underlying question never did.
Here is the lineage in one table, because seeing the continuity is the fastest way to understand why AI SOV is not a new invention but the latest skin on a sixty-year-old idea:
| Era | "Voice" was measured in | SOV numerator | SOV denominator |
|---|---|---|---|
| Mass media (1960s-1990s) | Ad spend / GRPs | Your ad spend | Total category ad spend |
| Search (2000s-2010s) | Organic + paid SERP visibility | Your weighted visibility | Total tracked-keyword visibility |
| Social (2010s) | Brand mentions across platforms | Your mentions | Total category mentions |
| AI answers (2023-2026) | Citations inside LLM answers | Your citations | Total brand citations in answers |
The structural definition that holds across all four eras:
| Component | Definition |
|---|---|
| Numerator | A count of attention units attributable to your brand |
| Denominator | The total count of those units across your defined competitive set |
| Channel | The surface where attention is measured (TV, SERP, social feed, AI answer) |
| Window | The time period over which counts accumulate (usually weekly or monthly) |
| Competitive set | The explicit list of brands you compete against for that attention |
The competitive-set row is the one people skip, and it quietly determines everything. SOV is meaningless without an explicit denominator. "We have 30% share of voice" is an incomplete sentence until you finish it with "...of these eight brands, across these 120 prompts, on Perplexity, in May." Change any of those four qualifiers and the 30% changes. I have seen agencies inflate a client's SOV simply by quietly narrowing the competitive set until the client looked dominant. The number was not a lie; the denominator was just chosen to flatter.
AI share of voice: the 2026 definition
AI share of voice is the percentage of brand citations or mentions your brand earns inside AI-generated answers, measured across a fixed prompt set against an explicit competitive set, over a defined time window. Concretely: you run 100 prompts against ChatGPT five times each, you parse all 500 answers, you count how many times each tracked brand appears as a citation, and your AI SOV is your brand's count divided by the total count across all tracked brands.
The mechanics differ from the older eras in three ways that matter:
| Difference | SEO-era SOV | AI-era SOV |
|---|---|---|
| Result structure | Ranked list, positions 1-10 | Cited or not cited, small source set |
| Determinism | Same query, same SERP (mostly) | Same prompt, varying answers (stochastic) |
| Index | One Google index | Four+ non-overlapping engine indexes |
| Click signal | Known CTR-by-position curve | No stable CTR curve; user may not click at all |
| Denominator stability | Stable keyword universe | Prompt set + engine + model version all drift |
Each of those differences makes AI SOV noisier and more fragile than its SEO ancestor. The stochasticity (same prompt, different answer) means a single measurement is a roll of the dice, not a reading. The four non-overlapping indexes mean a blended number averages across surfaces that behave nothing alike. The absence of a CTR-by-position curve means you cannot translate SOV into expected clicks the way SEO operators translated rank into traffic. And the drifting denominator means last quarter's 30% and this quarter's 30% may not be measuring the same thing if you changed your prompt set or the engine shipped a new model.
None of that makes AI SOV useless. It makes it a metric you have to handle with more care than the vendor dashboards imply. The single number on the dashboard is the end of a long chain of judgment calls, and most of the calls are invisible to the person reading the chart.
The classic AI SOV formula, decomposed
Here is the formula every tracker uses, broken into its parts so the assumptions are visible:
| Symbol | Meaning | Where the judgment hides |
|---|---|---|
| C_you | Count of your brand's citations across all prompt-runs | What counts as a "citation" (URL vs name-drop) |
| C_total | Count of all tracked brands' citations | Who is in the competitive set |
| P | Number of prompts in the set | Prompt selection bias (keyword vs conversational) |
| R | Runs per prompt (samples) | Too few runs = stochastic noise |
| SOV | C_you / C_total | The headline number |
The formula SOV = C_you / C_total looks objective. It is not. Every term above it embeds a choice. The most consequential is what you decide counts in C_you: do you count brand name-drops with no link, only clickable URL citations, or both? Counting name-drops inflates SOV and measures awareness; counting only URL citations deflates it and measures click-capable visibility. Both are defensible. They produce different numbers. A vendor that switches definitions between quarters can manufacture a trend.
Why classic AI share of voice is a vanity metric
Classic SOV treats every mention as worth the same, but mentions vary enormously in commercial value, so the headline number can move in the opposite direction from your revenue. A definitional citation in a "what is revenue attribution" answer, where the user reads the synthesized definition and never clicks, counts exactly as much as a comparison citation in a "best Stripe analytics tool for SaaS" answer that drove a high-intent click and a paid signup. The first mention is worth approximately zero dollars. The second might be worth your average customer lifetime value. SOV calls them equal.
I want to be precise about the word "vanity" here, because it is doing real work and I do not want to overreach. A vanity metric is not a fake metric. It is a real number that correlates poorly with the outcome you actually care about while feeling like it should correlate strongly. Classic SOV is exactly that. It is real, it is measurable, it is even a decent leading indicator at the top of the funnel. It becomes a vanity metric the moment a team optimizes for it directly or reports it to a board as evidence of business impact, because the link from SOV to revenue is mediated by a half-dozen factors the SOV number cannot see.
Here are the factors that sever the link between SOV and revenue:
| Factor | Effect on the SOV-revenue link |
|---|---|
| Citation context (definitional vs comparison) | Definitional mentions rarely click; comparison mentions convert |
| Citation position in source list | Position 1-3 capture most clicks; position 5+ near zero |
| Paraphrase completeness | If the model answers fully, the user never needs to click |
| Engine click economics | Perplexity clicks more than AI Overviews per citation |
| Buyer funnel position | Awareness-stage mentions click but rarely convert |
| Mobile vs desktop | Mobile AI apps make outbound clicks harder |
| Landing page quality | A click that hits a weak page does not convert |
Every one of those is invisible to a mention-count SOV. Stack them and you get the failure mode that opens this article: SOV up 40%, revenue flat. The new mentions were definitional, low-position, on mobile, hitting awareness-stage users who clicked through to a page that did not convert. The chart went up. The bank account did not.
A worked illustration with deliberately round numbers:
| Brand | Classic SOV | Citation-to-click | Click-to-paid | Effective conversion | Revenue rank |
|---|---|---|---|---|---|
| Brand A (the SOV winner) | 40% | 6% | 8% | 0.48% | 3rd |
| Brand B (the quiet winner) | 10% | 18% | 22% | 3.96% | 1st |
| Brand C | 30% | 9% | 10% | 0.90% | 2nd |
| Brand D | 20% | 5% | 6% | 0.30% | 4th |
Brand A holds four times Brand B's share of voice and finishes third in revenue. Brand B, with a tenth of the category's mentions, finishes first, because its mentions land in high-intent comparison contexts, on pages that convert, reaching buyers who are ready to choose. If Brand A's CMO reports SOV to the board and Brand B's CFO reports revenue, the two companies tell completely opposite stories about who is winning the AI channel. Only one of them is true.
This is not a hypothetical I constructed to make a point. It is the shape of the data I see repeatedly. The brand that wins the mention count and the brand that wins the revenue are frequently not the same brand, and the gap between them is exactly the information classic SOV throws away.
Revenue Share of Voice: the metric that fixes it
Revenue Share of Voice is classic share of voice weighted by the revenue each mention drives, rather than counting all mentions equally. Where classic SOV asks "what fraction of AI mentions are about us," Revenue SOV asks "what fraction of AI-driven revenue is ours." It is the same denominator-and-numerator structure, but the units are dollars instead of mentions.
The definition in one line: Revenue SOV = (revenue attributable to your AI mentions) / (total revenue attributable to all tracked brands' AI mentions).
In practice you rarely have your competitors' revenue, so the workable operational version uses your own data plus a category estimate:
| Form | Formula | When to use it |
|---|---|---|
| Pure Revenue SOV | Your AI revenue / total category AI revenue | When you have category revenue estimates |
| Self-relative Revenue SOV | Your AI revenue-per-mention / category avg revenue-per-mention | When you only know your own revenue |
| Position-weighted SOV | Mentions weighted by position-CTR curve | An intermediate proxy when revenue is not yet joined |
The cleanest way to understand Revenue SOV is as classic SOV multiplied by a quality factor. If your mentions convert exactly at the category average, your Revenue SOV equals your classic SOV. If they convert better, Revenue SOV exceeds classic SOV. If worse, it falls below. The ratio of the two is the diagnostic:
| Revenue SOV vs Classic SOV | What it means | What to do |
|---|---|---|
| Revenue SOV > Classic SOV | Your mentions punch above their weight | Keep the prompt mix; scale volume |
| Revenue SOV ≈ Classic SOV | Mentions convert at category average | Standard playbook applies |
| Revenue SOV < Classic SOV | Mentions are low-intent or low-converting | Shift to comparison prompts, fix landing pages |
| Revenue SOV much < Classic SOV | Classic SOV is a vanity number for you | Stop reporting SOV as an outcome |
Side by side, the two metrics:
| Dimension | Classic SOV | Revenue SOV |
|---|---|---|
| Numerator | Brand mentions / citations | Revenue from brand mentions |
| Denominator | Total category mentions | Total category AI-driven revenue |
| Weights every mention | Equally | By the revenue it drives |
| Data needed | Citation tracker only | Citation tracker + Stripe-joined revenue |
| Sees citation context | No | Yes, implicitly via conversion |
| Sees position effects | No | Yes, implicitly via click rate |
| Can be gamed by easy prompts | Yes | Much harder |
| Reportable as a business outcome | No | Yes |
| Who computes it in 2026 | Everyone | Almost nobody |
The last two rows are the punchline. Classic SOV cannot honestly be reported as a business outcome because the link to revenue is severed by everything in the previous section. Revenue SOV can, because the revenue join restores the link. And almost nobody computes Revenue SOV today, not because it is conceptually hard, but because it requires marrying two data sources that currently live in two different tools: citation counts in your visibility tracker, revenue per engine in your billing system. Marrying them is the whole job.
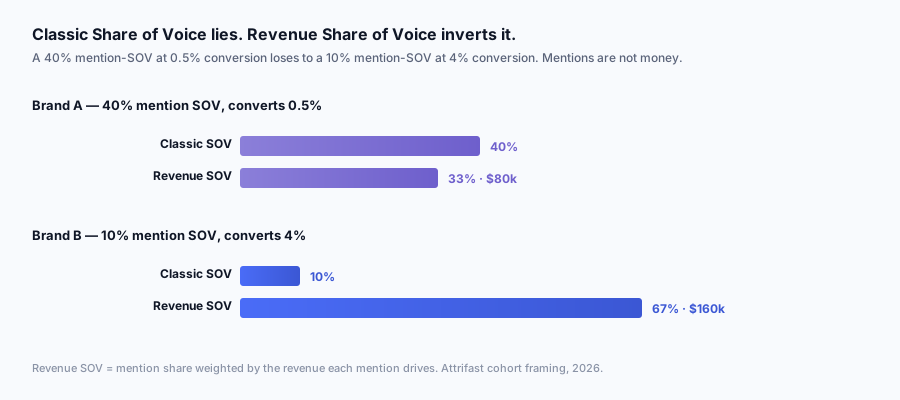
The 0.5% versus 4% case, in detail
The framing the user asked me to make concrete: a 40% SOV that converts at 0.5% versus a 10% SOV that converts at 4%. Let me run the actual arithmetic against a plausible AI-traffic base, using the 200-site dataset framing I lean on throughout this series (aggregate patterns across the SaaS and ecommerce sites I have measured, anonymized).
Assume a category where AI engines collectively drive 100,000 relevant answer-impressions per month across the tracked prompt set, and assume a citation translates to a site visit at the conversion rates below. Average order value $400 (mid-market SaaS annual-ish proxy).
| Brand | Classic SOV | Citations/mo | Conv. to paid | Customers/mo | Revenue/mo (AOV $400) |
|---|---|---|---|---|---|
| Loud brand | 40% | 40,000 | 0.5% | 200 | $80,000 |
| Quiet brand | 10% | 10,000 | 4.0% | 400 | $160,000 |
The quiet brand, with a quarter of the loud brand's share of voice, drives twice the revenue. Now compute Revenue SOV for the two of them within a simplified two-brand category (revenue of the two summed as the denominator):
| Brand | Classic SOV | Revenue | Revenue SOV |
|---|---|---|---|
| Loud brand | 40% | $80,000 | 33% |
| Quiet brand | 10% | $160,000 | 67% |
The ranking inverts completely. The loud brand "wins" classic SOV 40 to 10 and "loses" Revenue SOV 33 to 67. If you are the quiet brand and your competitor's agency is selling them a 40% SOV story, you should be delighted, not worried. You are taking two-thirds of the money out of the channel while they take two-thirds of the credit. That trade is fine with me every single time.
The general principle, stated cleanly: Revenue SOV equals classic SOV only when revenue-per-mention is uniform across the category. The more conversion varies between brands, the more the two metrics diverge, and conversion varies a lot. In a category where everyone has the same landing pages and targets the same prompts, classic SOV is a fine proxy. In any real category, where some brands target comparison prompts with strong pages and others get name-dropped in definitional answers, the two metrics tell different stories, and only the revenue one matters to the business.
How to measure classic AI share of voice, step by step
Before you can compute Revenue SOV you need classic SOV, so start here. The workflow is the same one I detailed in the multi-LLM tracker piece, compressed and reframed around the SOV calculation specifically.
Step 1: define the competitive set
Write down the explicit list of brands you compete with for the prompts you care about. Five to twelve is typical. This is your denominator. If you omit a strong competitor, your SOV is inflated; if you include weak ones, it is deflated. Be honest, or the number lies to you.
| Competitive-set sizing | SOV interpretation |
|---|---|
| 2-3 brands | SOV swings wildly; small sample, treat as directional |
| 4-8 brands | Stable, the usual sweet spot |
| 9-15 brands | Realistic for crowded categories; SOV numbers run smaller |
| 16+ brands | Denominator so large your SOV is tiny; segment instead |
Step 2: build the prompt set
This is where most SOV measurements quietly break. Keyword-research tools return Google-style phrases ("best CRM small business"); AI users type conversational questions ("what's a good CRM for a 5-person team on Stripe"). Build the prompt set from three sources blended:
| Prompt source | Contributes | Share of set |
|---|---|---|
| Keyword research (Ahrefs, Semrush) | Breadth of topics | 40% |
| Question expansion (conversational forms) | Real AI phrasing | 35% |
| Observed buyer language (sales calls, support, Reddit) | Highest-intent prompts | 25% |
Tag each prompt by intent class, because you will need that tag to interpret the SOV-revenue gap later:
| Intent class | Example | Commercial value |
|---|---|---|
| Definitional | "what is revenue attribution" | Low |
| How-to | "how to track ChatGPT traffic" | Medium |
| Comparison / best-of | "best Stripe analytics for SaaS" | Very high |
| Versus | "Attrifast vs Plausible" | Highest |
| Recommendation | "what tool should I use for X" | Very high |
| Troubleshooting | "why doesn't GA4 show ChatGPT" | High |
Step 3: run, sample, parse
Run each prompt against each engine, 3-5 times, on a schedule. Parse every answer for brand mentions and URL citations. Record per the schema below.
| Field | Type | Used for |
|---|---|---|
| prompt | text | Grouping |
| intent_class | enum | SOV-by-intent segmentation |
| engine | enum | Per-engine SOV |
| run_index | int | Stochastic dedup |
| brand_mentioned | bool | Mention-rate SOV |
| brand_cited_url | bool | Citation-rate SOV |
| citation_position | int | Position-weighted SOV |
| competitor_mentions | text[] | Denominator |
Step 4: compute the number
Per engine, sum your citations, sum total brand citations, divide. Then compute a blended SOV weighted by where your buyers actually are, not by the engines' aggregate user counts.
| SOV variant | How to compute | What it tells you |
|---|---|---|
| Mention SOV | Your mentions / total mentions | Brand awareness footprint |
| Citation SOV | Your cited URLs / total cited URLs | Click-capable visibility |
| Position-weighted SOV | Each citation weighted by position-CTR | Approximate click share |
| Blended SOV | Per-engine SOV weighted by buyer presence | Single number for reporting |
A worked example: three brands, 30 prompts, four weeks
Abstract formulas hide where the judgment calls live, so here is the full calculation end to end. A B2B SaaS category with three named competitors (Brand A, Brand B, Brand C). The prompt set is 30 buyer-intent prompts split 10 TOFU ("what is X"), 15 MOFU ("X vs Y," "best X for Y use case"), 5 BOFU ("X pricing," "is X worth it"). Two engines tracked, ChatGPT and Perplexity, each prompt run 7 times per week for 4 weeks, competitor set explicitly bounded to A/B/C.
Total observations: 30 prompts × 7 runs × 4 weeks × 2 engines = 1,680 prompt-runs. Within each run, citations are parsed and matched against the three competitor domains.
Raw citation counts (4-week window)
| Engine | Brand A citations | Brand B citations | Brand C citations | Total in-set citations |
|---|---|---|---|---|
| ChatGPT | 188 | 124 | 96 | 408 |
| Perplexity | 243 | 218 | 138 | 599 |
| Combined | 431 | 342 | 234 | 1,007 |
Per-engine share of voice (within the competitor set)
| Engine | Brand A SOV | Brand B SOV | Brand C SOV |
|---|---|---|---|
| ChatGPT | 46.1% | 30.4% | 23.5% |
| Perplexity | 40.6% | 36.4% | 23.0% |
| Equal-weighted blend | 43.3% | 33.4% | 23.3% |
Brand A leads on ChatGPT by a wider margin than on Perplexity, where Brand B is closer behind. The variance between engines is meaningful — Brand A's lead on ChatGPT (46.1% vs 30.4%) is structurally different from its lead on Perplexity (40.6% vs 36.4%). An equal-weighted blend hides that, which is exactly why the per-engine view below is the primary view and the blend is secondary.
Revenue-weighted blend (using Attrifast cohort B2B SaaS weights)
Assume revenue weights for this category are 35% ChatGPT, 45% Perplexity, with the remaining 20% from Claude/Gemini/AIO (not tracked in the example). Re-normalized across the two tracked engines: ChatGPT 44%, Perplexity 56%.
| Brand | ChatGPT SOV | Perplexity SOV | Revenue-weighted blend |
|---|---|---|---|
| Brand A | 46.1% | 40.6% | 43.0% |
| Brand B | 30.4% | 36.4% | 33.8% |
| Brand C | 23.5% | 23.0% | 23.2% |
The revenue-weighted blend favors Perplexity here because the category sends more revenue through Perplexity than ChatGPT. Brand B closes part of its gap to Brand A under revenue weighting because it is stronger on the higher-paying engine. The strategic read: Brand B should keep doubling down on Perplexity and close the ChatGPT gap; Brand A should defend ChatGPT while investing in Perplexity. This is the difference between counting mentions and weighting them by the money behind each engine — the same logic that separates classic SOV from Revenue SOV.
Sensitivity analysis: what happens when the competitor set widens
Widen the set to include Wikipedia, Reddit, and one large reference site that frequently appears in citations. The total pool grows by ~1,150 citations across the window (these sources are cited heavily for definitional and "what do people think" prompts).
| Brand | SOV (3-brand set) | SOV (3-brand + Wikipedia/Reddit/reference) |
|---|---|---|
| Brand A | 43.3% | 20.0% |
| Brand B | 33.4% | 15.8% |
| Brand C | 23.3% | 10.9% |
| Wikipedia | — | 24.0% |
| — | 18.0% | |
| Reference site | — | 11.2% |
That second column is a different metric. It measures total citation surface area, not competitive position within the named-brand set. Both are valid; both should be tracked. But the headline "share of voice" number for an executive should be the bounded competitor-set version, with the total-citation-diversity version reported alongside. The most common reporting error in this category is using the widened denominator to report a low number and then panicking — Brand A's 20% in the widened view is not worse than its 43% in the bounded view; they measure different things.
How to measure Revenue Share of Voice
Revenue SOV requires joining the citation data you just collected to first-party revenue, segmented by AI engine. The citation tracker gives you the numerator's mentions; your billing system gives you the dollars. The join is the part no tracker ships, so you either build it or use a tool that does. Here is the full pipeline.
The data flow:
The three data sources and who provides them:
| Data source | Provides | Tool category |
|---|---|---|
| Citation tracker | Mentions / citations per engine (numerator inputs) | Profound, SE Ranking, Geoptie, Loamly |
| Server-side referral detection | Sessions attributable to each AI engine | First-party analytics (Attrifast, Plausible) |
| Stripe webhook join | Revenue per attributed session | Revenue attribution (Attrifast) |
The join logic, step by step:
| Step | Action | Output |
|---|---|---|
| 1 | Collect classic SOV per engine from the tracker | SOV_chatgpt, SOV_perplexity, etc. |
| 2 | Detect AI-engine sessions server-side (cookieless) | Sessions per engine |
| 3 | Join sessions to Stripe payments via metadata | Revenue per engine |
| 4 | Compute your AI revenue total | Sum across engines |
| 5 | Estimate category AI revenue (or use self-relative) | Denominator |
| 6 | Divide | Revenue SOV |
For the denominator you have three honest options, in descending order of rigor:
| Denominator method | Rigor | Practicality |
|---|---|---|
| Actual competitor AI revenue | Highest | Rarely available |
| Modeled from competitor SOV + category avg conversion | Medium | Workable with assumptions |
| Self-relative (your revenue-per-mention vs category avg) | Lower but honest | Always available |
Most teams will start with the self-relative form because it only needs their own data. It does not give you a true market-share number, but it does give you the diagnostic that matters: is your revenue-per-mention above or below the category average, and is the gap widening or narrowing. That diagnostic is enough to make every decision Revenue SOV is supposed to inform.
A worked Revenue SOV calculation
Using the closed-loop month shape from my own attrifast.com logs (small absolute numbers, first-year SMB SaaS, but the structure is the point):
| Engine | Classic SOV (tracker) | Sessions (server-side) | Customers | Revenue | Rev-per-citation |
|---|---|---|---|---|---|
| ChatGPT | 12% | 6 | 1 | $15 | low |
| Perplexity | 31% | 7 | 2 | $30 | high |
| Claude | 8% | 2 | 1 | $15 | high |
| Gemini chat | 18% | 3 | 0 | $0 | zero |
| AI Overviews | n/a (impressions) | 14 | 0 | $0 | zero |
Read the Perplexity row against the ChatGPT row. Perplexity has 31% classic SOV here and produced $30; ChatGPT has 12% and produced $15. But notice Gemini: 18% classic SOV, $0 revenue. If you ranked these engines by classic SOV you would prioritize Gemini over ChatGPT. If you rank by revenue you would do the opposite. The Revenue SOV view reweights your entire engine-prioritization decision, and it reweights it toward the engines that actually pay.
Per-engine SOV divergence: why one number lies
The same brand routinely holds very different share of voice on each of the four engines, because the engines have non-overlapping indexes and different citation behavior, so a single blended SOV number averages across surfaces that behave nothing alike. Reporting one number hides the divergence that should drive your strategy.
From my 200-prompt weekly tracking on attrifast.com over the past several months, here is the kind of per-engine spread a single brand sees for the same prompt set:
| Engine | Typical SOV (illustrative, one brand) | Why it differs |
|---|---|---|
| Perplexity | 28-38% | Citation-forward, lower barrier for topical specificity |
| ChatGPT | 10-16% | Prefers high domain authority, slower corpus |
| Gemini / AIO | 12-20% | Rides existing Google organic rankings |
| Claude | 3-7% | Cites sparingly, prefers primary sources |
A brand can be a category leader on Perplexity and nearly invisible on Claude for the identical queries. The reasons trace directly to how each engine builds its index and decides what to cite, which I covered in depth in the tracker piece and the source-preference work there. The short version:
| Engine | Index basis | Citation density | SOV barrier to entry |
|---|---|---|---|
| ChatGPT | Training corpus + Bing-style live retrieval | 3-5 sources | High (DR-weighted) |
| Perplexity | Own crawl + Bing partnership | 4-7 sources | Low (topical match) |
| Claude | Training corpus + on-demand web search | 1-3 sources | Very high (sparse) |
| Gemini / AIO | Google's main index | 3-7 sources | Medium (tracks Google rank) |
The strategic consequence is that the engine where you have the highest SOV is often not the engine where you have the highest revenue, and a blended number erases both facts. Here is the cross-tabulation that makes the point:
| Engine | Classic SOV | Revenue SOV | Gap | Strategic read |
|---|---|---|---|---|
| Perplexity | 34% | 41% | +7pp | Over-performs; scale here |
| ChatGPT | 13% | 22% | +9pp | Under-cited but converts; push content |
| Gemini / AIO | 18% | 6% | -12pp | Cited but doesn't convert; impression channel |
| Claude | 5% | 9% | +4pp | Small but high-intent; don't dismiss |
The Gemini row is the trap. An operator optimizing for classic SOV would see 18% and invest. An operator looking at Revenue SOV would see that those citations convert at near zero (AI Overviews answers the user on the SERP, the click is a validation click, not a purchase click) and treat it as a brand-impression channel rather than a revenue channel. Same data, opposite decision. The blended single number would have hidden both the 34% Perplexity strength and the 18%-but-worthless Gemini weakness.
This is why I push every team toward a per-engine SOV table with a Revenue SOV column next to it, and away from the single hero number the dashboards want to show. The single number is built for a screenshot. The table is built for a decision.
SOV vs the other AI metrics: where it fits
Share of voice is one metric in a stack, and confusing it with its neighbors is common. Here is the full metric family and what each actually measures:
| Metric | Measures | Numerator | Owner of the data |
|---|---|---|---|
| Brand mention rate | How often you're named | Prompts where brand appears | Citation tracker |
| Citation rate | How often you're linked | Prompts where URL cited | Citation tracker |
| Share of voice (classic) | Your share of mentions | Your mentions / total | Citation tracker |
| Position-weighted SOV | Click-weighted share | Mentions x position-CTR | Citation tracker (rarely) |
| Citation-to-click rate | Clicks per citation | Sessions / citations | First-party + tracker |
| Revenue SOV | Your share of AI revenue | Your AI revenue / category | First-party revenue join |
| AI-attributed RPV | Revenue per AI visit | Revenue / AI sessions | First-party revenue join |
The metric family sorts cleanly into two camps by who owns the data:
| Camp | Metrics | Data lives in |
|---|---|---|
| Upstream (you appeared) | Mention rate, citation rate, classic SOV, position-weighted SOV | Citation tracker (third-party scrape) |
| Downstream (you got paid) | Citation-to-click, Revenue SOV, AI-attributed RPV | Your first-party analytics + billing |
Revenue SOV is the bridge metric. It is the only one that requires both camps' data, which is precisely why it is the hardest to compute and the most valuable to have. The upstream-only tools cannot reach it because they never see your Stripe data. The downstream-only tools cannot reach it because they never see your competitors' citation counts. You need the join.
A common confusion worth clearing up: SOV versus share of search. They are cousins, not twins.
| Metric | What it measures | Funnel position | Pioneer |
|---|---|---|---|
| Share of search | Your share of branded search queries | Demand that already exists | Les Binet [3] |
| AI share of voice | Your share of AI-answer mentions | Category exploration, pre-preference | 2026 GEO tools |
| Revenue SOV | Your share of AI-driven revenue | Conversion, bottom of funnel | Effectively new |
Share of search measures people already searching your name, which is a strong market-share predictor because it captures realized demand. AI SOV measures whether you appear when buyers are still exploring the category and have not formed a preference, which is earlier in the funnel. Revenue SOV measures the money at the bottom. A complete AI-marketing dashboard tracks all three, because they answer three different questions: are people already looking for me (share of search), do I show up when they explore (AI SOV), and does showing up pay (Revenue SOV).
SOV tooling comparison: who measures what
Every major AI-visibility tracker reports classic SOV. None of them compute Revenue SOV, because none of them join to your billing system. Here is the honest landscape, pricing at entry tier, capabilities from each vendor's published documentation cross-checked against hands-on use where I have it.
| Tool | Category | Reports classic SOV? | Engines | Entry price | Computes Revenue SOV? |
|---|---|---|---|---|---|
| Profound | Enterprise AI citation analytics | Yes (sentiment + SOV) | ChatGPT, Perplexity, Claude, Gemini, Copilot | $499+/mo | No |
| SE Ranking AI Tracker | SERP-adjacent AI visibility | Yes (visibility score) | Gemini, AIO, ChatGPT | $52+/mo add-on | No |
| SEOcrawl Prompt Tracking | Agency prompt-rank tracking | Yes (per-prompt share) | Perplexity, Gemini, Claude | $49+/mo add-on | No |
| Geoptie | Cheap unified four-engine | Yes (share of voice) | ChatGPT, Perplexity, Claude, Gemini | $29/mo | No |
| Loamly | SMB AI mention monitoring | Yes (mention share) | ChatGPT, Perplexity, Gemini | $99+/mo | No |
| Otterly | Daily-check AI monitoring | Yes (SOV + sentiment) | ChatGPT, Perplexity, AIO | $29/mo | No |
| Attrifast | First-party revenue attribution | No (not a citation tracker) | All, via referral + Stripe | $15/mo | Yes (with tracker SOV input) |
The category split is the thing to internalize:
| Job to be done | Tool category | Example |
|---|---|---|
| "What's our classic SOV in AI answers?" | Citation tracker | Profound, Geoptie, Loamly |
| "Which engine sends us paying customers?" | Revenue attribution | Attrifast |
| "What's our Revenue SOV?" | Both, joined | Tracker SOV + Attrifast revenue |
The trackers are good at what they do. I am not knocking Profound or Geoptie; they solve the upstream measurement honestly. The point is narrower: the upstream tools structurally stop at classic SOV, and classic SOV is the vanity half of the metric. To get the revenue half you have to bring your own first-party data, which is the layer the trackers do not and will not ship, because they scrape AI answers from the outside and have no view into your Stripe account.
A feature-by-feature cut for the teams that want it:
| Feature | Profound | Geoptie | Loamly | Otterly | SE Ranking | Attrifast |
|---|---|---|---|---|---|---|
| Classic SOV | Yes | Yes | Yes | Yes | Yes | No |
| Per-engine SOV breakout | Yes | Yes | Yes | Limited | Limited | No |
| Sentiment | Yes | No | Limited | Yes | No | No |
| Competitor SOV | Yes | Yes | Yes | Yes | Limited | No |
| Server-side session detection | No | No | No | No | No | Yes |
| Stripe revenue join | No | No | No | No | No | Yes |
| Revenue SOV (joined) | No | No | No | No | No | Yes* |
| Cookieless | n/a | n/a | n/a | n/a | n/a | Yes |
| Entry price | $499 | $29 | $99 | $29 | $52 | $15 |
*Revenue SOV in Attrifast means the revenue-per-engine half of the equation; you supply the classic-SOV numerator from your tracker of choice and Attrifast supplies the revenue weighting. We deliberately do not pretend to ship the citation-scrape side we do not measure.
Designing the prompt set that makes SOV honest
The prompt set is the hidden variable that determines whether your SOV number is honest or flattering, because you can manufacture a high SOV by stuffing the set with easy definitional prompts you are sure to be cited in. A well-designed set is balanced across intent classes so the resulting SOV reflects your real competitive position rather than your prompt-selection bias.
The failure mode in a table:
| Prompt set design | Resulting classic SOV | Honesty |
|---|---|---|
| 90% definitional ("what is X") | Inflated, easy to win | Low; vanity by construction |
| 90% comparison ("best X for Y") | Deflated, hard to win | Low; pessimistic by construction |
| Balanced across intent classes | Realistic | High |
| Weighted toward buyer-observed prompts | Realistic + revenue-relevant | Highest |
A balanced 100-prompt set I would defend to a board:
| Intent class | Share | Count | Why |
|---|---|---|---|
| Definitional | 15% | 15 | Top-funnel awareness, easy citations |
| How-to | 20% | 20 | Mid-funnel, moderate intent |
| Comparison / best-of | 18% | 18 | High commercial intent |
| Versus | 12% | 12 | Highest intent, the money prompts |
| Recommendation | 12% | 12 | High intent |
| Specific use case | 13% | 13 | Qualified, niche buyers |
| Troubleshooting | 10% | 10 | High intent, problem-aware |
Now the key move for Revenue SOV: tag each intent class with its expected conversion, so you can predict where your classic SOV and Revenue SOV will diverge before you even join the revenue data.
| Intent class | Citation difficulty | Expected click intent | Expected conversion |
|---|---|---|---|
| Definitional | Easy | Low | Very low |
| How-to | Medium | Medium | Low-medium |
| Comparison / best-of | Hard | Very high | High |
| Versus | Hard | Highest | Highest |
| Recommendation | Medium-hard | Very high | High |
| Specific use case | Medium | High | Medium-high |
| Troubleshooting | Medium | High | Medium-high |
The lesson the table teaches: the prompts that are easiest to win classic SOV in (definitional) are the ones with the lowest conversion, and the prompts that are hardest to win (versus, comparison) are the ones with the highest conversion. So a brand chasing classic SOV will naturally drift toward the low-value prompts, inflating the vanity number while starving the revenue. A brand chasing Revenue SOV does the opposite: it fights the hard, high-intent prompts because that is where the money is, even though its classic SOV stays modest. The two metrics pull your content strategy in opposite directions, and only one direction pays.
A monitoring cadence for SOV and Revenue SOV
How often to measure each, and what to do with the numbers:
| Metric | Cadence | Sample depth | Action threshold |
|---|---|---|---|
| Classic SOV per engine | Weekly | 3-5 runs/prompt | Investigate any >5pp weekly swing |
| Blended classic SOV | Weekly | Aggregated | Trend, not absolute |
| Citation-to-click rate | Monthly | Full month sessions | <5% means click problem |
| Revenue per engine | Monthly | Stripe-joined | Reweight engine priority |
| Revenue SOV | Quarterly | Full quarter | The board number |
The reason classic SOV is weekly and Revenue SOV is quarterly is sample size. SOV mentions accumulate fast (hundreds of prompt-runs a week), so weekly trends are meaningful. Revenue events accumulate slowly for an SMB (a handful of AI-attributed customers a month), so you need a quarter to see signal through the noise. Reporting Revenue SOV weekly for a small SaaS is the same statistical error as reporting SOV from a 5-prompt set: you are charting variance and calling it a trend.
The reconciliation routine I run monthly:
| Check | Question | Red flag |
|---|---|---|
| SOV vs Revenue SOV gap | Is the gap widening? | Revenue SOV falling while classic SOV rises |
| Per-engine divergence | Which engine over/under-performs? | High SOV engine with zero revenue |
| Intent-class mix | Are wins concentrated in low-value prompts? | All SOV gains in definitional prompts |
| Position drift | Are citations slipping down source lists? | Average position climbing past 3 |
| Competitor delta | Are we gaining or losing relative share? | Competitor SOV growing faster |
Common mistakes measuring AI share of voice
I have made most of these. Roughly the order operators make them.
Mistake 1: reporting classic SOV as a business outcome. It is an input metric. The moment it appears on a board slide next to revenue figures as if it were peer to them, someone will optimize for it and starve the revenue. Fix: report classic SOV as a leading indicator, Revenue SOV as the outcome.
Mistake 2: using a single blended SOV number. Hides the per-engine divergence that should drive your strategy. A 20% blend can be 38% Perplexity and 5% Claude, which demand opposite content moves. Fix: per-engine table, always.
Mistake 3: stuffing the prompt set with easy prompts. Inflates SOV by construction. If 80% of your prompts are definitional, your SOV is measuring how good you are at winning prompts that do not convert. Fix: balance the intent-class mix and weight toward buyer-observed language.
Mistake 4: sampling each prompt once. LLMs are stochastic; one sample is one roll of the dice. Fix: 3-5 runs per prompt, report the average or union.
Mistake 5: counting name-drops and URL citations as the same thing. A mention with no link cannot drive a click. Conflating them inflates click-capable SOV. Fix: track both, use citation SOV for revenue analysis and mention SOV for brand analysis.
Mistake 6: ignoring citation position. A position-5 citation and a position-1 citation count equally in naive SOV but click at wildly different rates. Fix: compute position-weighted SOV as an intermediate before you have the full revenue join.
Mistake 7: changing the competitive set between periods. Quietly narrowing the denominator manufactures a flattering trend. Fix: freeze the competitive set; if you must change it, recompute history on the new set.
Mistake 8: comparing your SOV to an absolute benchmark. There is no universal good SOV number; it is relative to your set and prompts. A 30% in a two-brand category is weak; in a fifteen-brand category it is dominant. Fix: benchmark against your own trend and the classic-vs-Revenue gap, not a magazine number.
Mistake 9: treating AI Overviews SOV as revenue-bearing. AIO answers the user on the SERP; the citation is often a validation click, not a purchase click. High AIO SOV with near-zero conversion is the canonical case. Fix: treat AIO as an impression channel in Revenue SOV, weight accordingly.
Mistake 10: never joining to revenue. The meta-mistake this whole article exists to fix. Classic SOV without a revenue join is, by definition, a vanity metric. Fix: bring your first-party revenue, compute Revenue SOV, report that.
What changes when you adopt Revenue SOV
The shape of the monthly marketing review changes once Revenue SOV is in the stack. The before/after I share with teams:
| Review dimension | Classic-SOV-only review | Revenue-SOV review |
|---|---|---|
| Headline metric | "SOV is up 12pp" | "Revenue SOV is up 4pp, classic flat" |
| Engine prioritization | By mention count | By revenue per engine |
| Content prioritization | Prompts easiest to be cited in | Prompts that convert |
| Prompt-set design | Maximize citations | Maximize revenue-weighted citations |
| Agency accountability | "We grew your visibility" | "We grew your AI revenue share" |
| Board narrative | "AI is working" (unfalsifiable) | "AI drove $X, here's our share" |
| Budget allocation | Toward high-SOV engines | Toward high-Revenue-SOV engines |
| Competitive read | "We out-mention them" | "We out-earn them in the channel" |
The agency-accountability row is the one with the most political charge. An agency selling classic SOV can always show a number going up, because there is always some prompt set and competitive set under which visibility improved. Revenue SOV is harder to game because it terminates in your Stripe account, which does not care about the agency's narrative. If you are paying for GEO and the only metric on the report is classic SOV, you are paying for a number that cannot, even in principle, be reconciled against your bank balance. Ask for the revenue join. If the agency cannot produce it, that is information.
What this looks like inside Attrifast
A short, honest note on the product, because this article has a clear commercial interest and pretending otherwise would be the kind of thing the forbidden-wording list exists to prevent. Attrifast is not a citation tracker. It does not replay prompts against ChatGPT and count your mentions; Profound, Geoptie, SE Ranking, and Loamly do that, and they do it well. What Attrifast ships is the half those tools cannot: the per-engine revenue attribution that converts a tracker's classic SOV into Revenue SOV.
| Layer | Who provides it | What it gives you |
|---|---|---|
| Classic SOV per engine | Your citation tracker | The numerator's mention counts |
| AI-engine session detection | Attrifast (cookieless, server-side) | Sessions per engine |
| Stripe revenue join | Attrifast (webhook, OAuth) | Revenue per engine |
| Revenue SOV | You, combining the two | The reportable outcome |
The mechanics on the Attrifast side: a 4 KB cookieless script, server-side referral detection against the AI-engine domain list, a Stripe checkout.session.completed webhook join that requires no manual reconciliation, and a per-engine revenue breakdown in the same dashboard as your other channels. Setup is roughly two minutes if you are on a supported stack. The Pro tier is $15/mo, with a free tier for one site. The full mechanics of the detection and revenue join live in the revenue attribution feature page and the per-engine tracking guides for ChatGPT, Perplexity, Claude, and Gemini.
The first-person reason I built it: I was the operator with the beautiful SOV chart and the unanswerable revenue question, on my own SaaS, in 2024. I had the visibility number. I could not tell my own board what it was worth. Revenue SOV is the metric I wished I could compute then, and the revenue join is the piece I had to build to compute it.
Limitations
Things this article does not cover, and where my honest answer is "I do not know yet."
- Competitor revenue is rarely observable. True market-level Revenue SOV needs your competitors' AI-driven revenue, which you almost never have. The self-relative form (your revenue-per-mention vs category average) is the practical fallback, and it gives you the diagnostic without the absolute share.
- The citation-to-click rates are observational. The 5-25% ranges come from my own logs plus published research, not a controlled experiment. They vary by engine, category, and citation context. Treat them as directional.
- Voice and multimodal queries produce a mention with no click and no session, so they contribute to classic SOV (if a tracker catches them) but cannot contribute to Revenue SOV. Known undercount on the revenue side.
- Model and engine version drift is constant. A SOV number tied to a specific model version has roughly a six-month half-life. Re-measure when an engine ships a major version.
- The 200-site framing is an aggregate. The patterns hold across the SaaS and ecommerce sites I have measured; the absolute numbers for your category and ACV will differ. Re-measure on your own data.
- Revenue SOV is not yet an industry-standard metric. I am describing a concept and a calculation, not citing a Gartner-blessed definition. The classic-SOV lineage is well established; the revenue-weighted version is a logical extension I and a handful of others are pushing, not a settled standard.
FAQ
What is AI share of voice?
AI share of voice (SOV) is the percentage of brand mentions or citations your brand earns inside AI answers, measured against the total mentions of all tracked brands across a fixed set of prompts. If you run 100 prompts against ChatGPT and your brand is cited 30 times while all competitors collectively appear 70 times, your AI SOV is 30%. It is the AI-era analog of the share-of-voice metric advertising agencies have used since the 1960s, when SOV meant your share of total category ad spend. The mechanics changed (mentions instead of ad dollars) but the core idea is identical: what fraction of the conversation is about you. Every major AI-visibility tracker in 2026 (Profound, SE Ranking, SEOcrawl, Geoptie, Loamly, Otterly) reports a version of this number.
How do I measure share of voice in ChatGPT?
Build a fixed prompt set of 50-300 conversational queries your buyers actually ask, run each prompt against ChatGPT on a recurring schedule (3-5 samples per prompt to average out the model's stochastic sampling), parse every answer for brand mentions and citation URLs, then compute your brand's mentions divided by total brand mentions across all tracked brands. Repeat weekly and chart the trend. The arithmetic is simple; the hard parts are choosing prompts that match real buyer language rather than keyword-research phrasing, and sampling enough times per prompt that you are measuring signal rather than the temperature-driven variance of a single roll of the dice.
What is Revenue Share of Voice?
Revenue Share of Voice (Revenue SOV) is classic share of voice weighted by the revenue each mention actually drives, rather than counting every mention as equal. Where classic SOV asks "what fraction of AI mentions are about us," Revenue SOV asks "what fraction of AI-driven revenue is ours." The formula is your AI-attributed revenue divided by the estimated total AI-attributed revenue across your competitive set. A brand with 40% classic SOV whose mentions convert at 0.5% can have a smaller Revenue SOV than a brand with 10% classic SOV whose mentions convert at 4%. The metric requires joining citation data (which the visibility trackers provide) to first-party revenue data (which they do not), which is why almost nobody reports it yet.
Why is classic AI share of voice a vanity metric?
Because it counts every mention as equal when mentions are wildly unequal in commercial value. A definitional citation in a "what is X" answer where the user got their answer and never clicked is counted identically to a comparison citation in a "best X for Y" answer that drove a high-intent click and a sale. Classic SOV also ignores citation position, citation context, the engine's click economics, and whether the mention reached a buyer or a tire-kicker. You can grow your classic SOV 40% in a quarter and watch your AI-attributed revenue stay flat, because the new mentions landed in low-intent contexts. SOV is a real input metric. It becomes a vanity metric the moment a team reports it to a board as if it were an outcome.
How is Revenue SOV different from classic SOV mathematically?
Classic SOV is unweighted: SOV equals your mentions divided by total mentions. Revenue SOV weights each mention by the revenue it produced: Revenue SOV equals the sum of revenue from your mentions divided by the sum of revenue across all brands' mentions. Equivalently, you can decompose it as classic SOV multiplied by your relative revenue-per-mention. If your revenue-per-mention equals the category average, your Revenue SOV equals your classic SOV. If your mentions convert better than average, Revenue SOV exceeds classic SOV. If your mentions convert worse, Revenue SOV falls below it. The gap between the two numbers is the single most actionable diagnostic in AI marketing.
Does share of voice differ across ChatGPT, Perplexity, Claude and Gemini?
Substantially. The four engines have non-overlapping indexes and different citation behavior, so the same brand routinely has very different SOV on each. In my own tracking across 200 prompts, a brand can hold 35% SOV on Perplexity (citation-forward, lower barrier for topical specificity) while sitting at 12% on ChatGPT (prefers high domain authority) and under 5% on Claude (cites sparingly and prefers primary sources). A single blended SOV number hides this divergence. You should report per-engine SOV plus a weighted blend, where the weights reflect where your actual buyers spend time, not the engines' aggregate user counts.
How many prompts do I need to measure AI share of voice reliably?
Minimum 50 prompts per engine for trend detection; 100-300 is materially better. Below about 50 prompts the week-to-week sampling variance (driven by the model's stochastic token sampling plus continuously updating retrieval indexes) swamps the signal you are trying to detect, and you will chase noise. Above 300 prompts the marginal information per prompt drops and the labor or tool cost climbs faster than the insight. Sample each prompt 3-5 times per measurement period and report the union or the average of cited sources, not a single roll, or you will see false volatility that has nothing to do with your actual visibility.
Can I calculate AI share of voice for free?
Partially. You can manually query each engine weekly with a small prompt set (10-30 prompts), log brand mentions and citations in a spreadsheet, and compute SOV with a pivot table. That captures presence and rough trend for free but costs real labor (roughly 30 seconds per query, so 30 prompts across 4 engines is two hours a week) and breaks down past about 30 prompts. Free tiers from Otterly, Profound, and SE Ranking offer 5-25 tracked prompts with limited engine coverage. For 50-300 prompts across all four engines on a daily or weekly cadence, expect $29-$499 per month. None of those tools compute Revenue SOV, because none of them see your revenue.
What is a good AI share of voice percentage?
There is no universal good number because SOV is relative to your competitive set and your prompt selection. A 30% SOV in a two-competitor category is mediocre; a 30% SOV in a fifteen-competitor category is dominant. More useful than the absolute number is the trend (is your SOV rising or falling quarter over quarter) and the gap between your classic SOV and your Revenue SOV. If you must benchmark, the rough pattern I see is that category leaders hold 25-45% classic SOV on their best engine, challengers 8-20%, and new entrants under 5% for the first two to three quarters of a serious GEO effort.
How does citation position affect share of voice?
Heavily on click economics, lightly on the raw SOV count. Most trackers compute SOV as an unweighted mention count, so a citation at position 5 in a source list counts the same as a citation at position 1. But click-through follows a steep curve: the top 2-3 sources in a Perplexity, ChatGPT, or Gemini source list capture the large majority of outbound clicks. This is exactly why classic SOV and Revenue SOV diverge. A position-weighted SOV (each mention weighted by the typical CTR of its position) is a useful intermediate metric that sits between the naive count and the full revenue join, and it is one most trackers could compute but few do.
Do AI engines mention brands without linking to them?
Constantly, and the distinction matters for SOV. A brand mention without a citation link is brand-only exposure: the model named you, which builds awareness, but there is no clickable path back to your site, so the mention cannot directly drive a tracked session or revenue. A URL citation is a clickable path. Most trackers report both a brand-mention rate and a URL-citation rate. For brand-marketing analysis, mention rate is the right SOV numerator. For revenue analysis, URL-citation rate is the right one, because only cited URLs can produce the clicks that produce revenue.
How do I improve my AI share of voice?
The highest-leverage moves in my testing, in order: ship FAQPage schema with four or more genuine question-answer pairs on commercial pages, lead each page with a Direct Answer paragraph under 120 words that an engine can lift, build honest Versus and Alternatives pages because comparison prompts have the highest commercial intent, disambiguate your brand entity with four or more sameAs links so engines do not confuse you with a similarly named company, and cite primary sources inline so the model treats your page as a citable secondary source. But raising classic SOV is only half the job. Raising Revenue SOV also means targeting the prompts that convert, not just the prompts that are easy to be cited in.
Is share of voice the same as share of search?
Related but not identical. Share of search, popularized by Les Binet, measures your brand's share of total branded search queries (how often people Google your brand versus competitors) and is a strong leading indicator of market share. AI share of voice measures your share of mentions inside AI-generated answers. Both are proxies for mental availability, but they sit at different points in the funnel: share of search captures demand that already exists (people searching your name), while AI SOV captures whether you show up when buyers are still exploring the category and have not yet formed a brand preference. AI SOV is closer to the top of the funnel.
Does Attrifast measure AI share of voice?
Attrifast does not ship a prompt-replay citation tracker that computes classic SOV in mid-2026; tools like Profound, SE Ranking, Geoptie, and Loamly do that well. What Attrifast ships is the missing half: the per-engine revenue attribution that turns a citation tracker's classic SOV into Revenue SOV. You bring the citation counts from your visibility tracker; Attrifast brings the Stripe-joined revenue per engine via cookieless server-side tracking. Multiply the two together and you get the Revenue SOV the trackers structurally cannot compute on their own, because they never see your Stripe data.
Related reading
This article covers both classic AI share of voice and the proprietary Revenue SOV framework — when each one matters, and why mention-count SOV is a vanity number once you can join citations to Stripe revenue. The worked 3-brand × 30-prompt example above walks the full classic-SOV calculation if you want the pure methodology. For the broader AI traffic measurement context, see AI Traffic Analytics in 2026: The Complete Playbook. And for the revenue-join half Attrifast actually ships — the per-engine attribution that turns a tracker's classic SOV into Revenue SOV — see the revenue attribution feature page and the per-engine guides for ChatGPT, Perplexity, Claude, and Gemini.
References
- Kantar — Share of voice and the history of advertising measurement
- Nielsen — Marketing measurement and share of voice research
- Les Binet & Peter Field / IPA — Media in Focus and the excess-share-of-voice (ESOV) effect
- Profound — AI search visibility, share of voice and citation behavior research
- Perplexity — PerplexityBot crawler documentation and citation behavior
- SE Ranking — AI visibility and ChatGPT tracker documentation
- Search Engine Land — Google AI Overviews appearance and prevalence tracking 2024-2026
- Backlinko — How AI Overviews are affecting organic CTR
- Semrush — AI Overviews and generative search visibility research
- OpenAI — Overview of OpenAIs bots and how to control them
- Anthropic — Does Anthropic crawl data from the web, and how can site owners block the…
- Pew Research Center — Americans use of ChatGPT and AI assistants for search
- Gartner — Predicts: traditional search volume and the shift to AI assistants
- BrightEdge — Generative AI search and citation share research
- StatCounter — Search engine market share worldwide, desktop and mobile
- Google Analytics — Default channel group definitions for GA4
- Ahrefs — GEO and AI search visibility research
- Stripe Docs — Checkout Session metadata field
- Journal of Marketing / academic literature on share of voice and market share.…
- Byron Sharp / Ehrenberg-Bass Institute — How Brands Grow: mental availability and…
- Similarweb — AI chatbot and search engine traffic data
For the upstream half of this metric (how to track citations across the four engines and read per-engine divergence), see the AI visibility tracker breakdown. For the strategic split between answer-engine and classic search optimization, AEO vs SEO in 2026 is the companion. For the revenue side at the channel level, the AI traffic revenue benchmark walks the per-engine RPV data this article's Revenue SOV calculation depends on. And if you want the revenue-join layer out of the box rather than building it, the revenue attribution feature page and the per-engine guides for ChatGPT, Perplexity, Claude, and Gemini cover the product side end to end.