
A founder I know runs a $32k MRR project management SaaS. She paid Dreamdata $9,000 for an annual contract in January 2026 because her board pushed for "real attribution." Six months in, the tool was sitting unused because the data volume was too thin for the multi-touch models to converge, the team had no analyst to maintain the integration, and the actionable decisions it produced were the same decisions she could have read off a last-touch spreadsheet at zero cost. The product was not bad. It was a $9,000 wrong tool for a $32k MRR right problem.
This article is the playbook I wish she had read before signing that contract. It is not anti-Dreamdata, anti-Factors.ai, or anti-HockeyStack; those are excellent products at the scale they are built for. It is pro-honest-staging, where the attribution sophistication you adopt should match the MRR stage and channel-mix complexity you are operating at. Most "SaaS marketing attribution" content on the public web is written for enterprise and reads as gospel for bootstrapped founders, which is how a 30-person SaaS ends up paying enterprise prices for enterprise infrastructure to solve a problem that does not yet exist.
I have run attribution on attrifast.com from $0 MRR to where it is today, and stitched the same architecture into roughly forty channels across a handful of client SaaS properties between $4k MRR and $1.8M MRR. The patterns below are what worked. The companion pieces walk specific surfaces: the ChatGPT referral analytics guide for AI-engine attribution, the AEO vs SEO 2026 strategy piece for content effort split, and the product pages for Attrifast itself at /for/bootstrapped-saas, /for/stripe, and /features/revenue-attribution.
Quick Facts
| Metric | Value | Source |
|---|---|---|
| Median B2B SaaS trial-to-paid conversion rate | 14-25% | OpenView SaaS Benchmarks 2024 [1] |
| Median B2B SaaS sales cycle (self-serve) | 7-14 days | ChartMogul SaaS Metrics report [3] |
| Median B2B SaaS sales cycle (AE-assisted) | 30-90 days | Bessemer State of the Cloud 2025 [2] |
| Median touchpoints to B2B SaaS purchase | 7-12 touches | Forrester B2B Buyer Survey 2024 [13] |
| Dreamdata entry pricing (2026) | $750+/mo | Dreamdata pricing page [4] |
| Factors.ai entry pricing (2026) | $799+/mo | Factors.ai pricing [5] |
| HockeyStack entry pricing (2026) | $1,200+/mo | HockeyStack public pricing |
| GA4 vs Stripe revenue gap (median) | 18-35% understated by GA4 | Attrifast aggregate, n=38 |
| Cookieless attribution coverage (Attrifast) | 92-96% of paid signups | Attrifast internal, Q1 2026 |
| Ad blocker session loss (B2B SaaS) | 15-30% of sessions | Stripe Atlas analytics post [10] |
| Median bootstrapped SaaS MRR (Indie Hackers) | $4,800 | Indie Hackers community data [11] |
| Share of SaaS startups under $10k MRR | Roughly 75% of public profiles | Indie Hackers / ProfitWell [11][7] |
| B2B SaaS organic search share of trial signups | 28-42% | OpenView benchmarks [1] |
| Median Stripe webhook event types per SaaS | 12-18 active | Stripe documentation [9] |
| SaaS LTV/CAC target threshold | 3.0x or higher | SaaStr / Tomasz Tunguz [6][8] |
| Free trial standard length (B2B SaaS) | 14 days (50%+ of SaaS) | OpenView SaaS Benchmarks [1] |
Two numbers do most of the analytical work in this article. The first is the 7-12 touches it takes to convert a typical B2B SaaS buyer per Forrester [13], which explains why pure last-touch breaks above a certain scale. The second is the 75% of public Indie Hackers SaaS profiles under $10k MRR [11], which explains why most attribution content overshoots the actual operator audience by 10x in budget and complexity.
Why SaaS attribution differs from e-commerce attribution
The default attribution playbooks on the public web are written either for e-commerce (Shopify-shaped, short sales cycles, one-session conversion) or for enterprise B2B (long sales cycles, multi-stakeholder buying, six-figure ACVs). SaaS sits between them, and the misfit shows up in five places where applying the wrong template produces systematically wrong decisions.
1. The conversion event is decoupled from the marketing touch. An e-commerce purchase happens in the same session as the marketing click 60-75% of the time across the DTC sites I have measured. A SaaS trial signup is just step one of three (signup, activation, paid conversion), and the paid conversion typically happens 14-30 days after the signup session ended. The attribution model has to span that window or it credits the wrong channel.
2. Free trials decouple intent from revenue. A user who signs up for a free trial has not yet decided to pay you. Treating trial signups as conversions inflates your attribution numbers; treating only paid conversions as conversions undercounts your funnel-top channels. SaaS attribution has to model both events and link them.
3. Buying committees confuse the click-identity to buy-identity mapping. In B2B SaaS especially, 3-7 people may research the tool, one signs up for the trial, a different person signs the contract, and a fourth person actually uses it day to day. The "who clicked the ad" identity is often not the "who decided to buy" identity. Forrester's 2024 B2B Buyer Survey [13] puts the typical committee size at 6-10 people for software purchases over $5k ACV.
4. The session-to-revenue join requires Stripe metadata propagation. Stripe Checkout's metadata field [9] is the right primitive to carry session ID and source through to the webhook, but most SaaS teams do not wire it correctly the first time. The most common mistake: the metadata is set on the Checkout Session but not propagated to the Subscription or Customer, so the webhook fires without the attribution data attached.
5. The retention dimension matters. An e-commerce purchase is one revenue event. A SaaS subscription is a recurring stream where the lifetime value depends on retention. Attribution that does not weight by LTV systematically over-credits channels that drive high-churn customers and under-credits channels that drive sticky ones.
The structural comparison:
| Attribution dimension | E-commerce | B2C SaaS | B2B SaaS (self-serve) | B2B SaaS (AE-assisted) |
|---|---|---|---|---|
| Sales cycle | Minutes to hours | 1-7 days | 7-30 days | 30-180 days |
| Conversion event | Order placed | Paid subscription | Trial start, then paid | Demo booked, then closed-won |
| Trial in funnel | No | Sometimes (freemium) | Yes (14-30 days typical) | Yes, plus sales motion |
| Touchpoints to convert | 1-3 | 2-5 | 5-9 | 7-15 |
| Buying committee size | 1 | 1 | 1-3 | 3-10 |
| Identity stitching needs | Light | Medium | High | Very high |
| Revenue model | One-time | Recurring | Recurring | Recurring + expansion |
| LTV weighting matters | No | Yes | Yes | Yes |
| Best attribution model (default) | Last-touch | Last-non-direct | First-touch on trial + last-touch on paid | First-touch + multi-touch position |
| Dominant integration | Shopify webhook | Stripe webhook | Stripe + product analytics | Stripe + CRM (HubSpot/Salesforce) |
The B2B SaaS columns are where most public attribution content fails. The default e-commerce model (last-touch on the purchase session) under-credits the funnel-top channels that drove the trial. The default enterprise model (multi-touch with marketing-mix modeling) overshoots the data volume a sub-$500k-MRR SaaS can support. The right answer for the middle is a stage-aware stack, which is what the next section walks through.
The four SaaS attribution stages, by MRR
Attribution sophistication should track MRR stage and channel-mix complexity. Below is the staging I use for both my own properties and the SaaS founders I advise. The boundaries are approximate (your mileage will vary by vertical, sales motion, and pricing) but the rough shape holds.
| MRR stage | Attribution model | Tool stack | Time investment | Annual cost |
|---|---|---|---|---|
| $0-5k MRR | Ask every customer | Spreadsheet | 5 min/week | $0 |
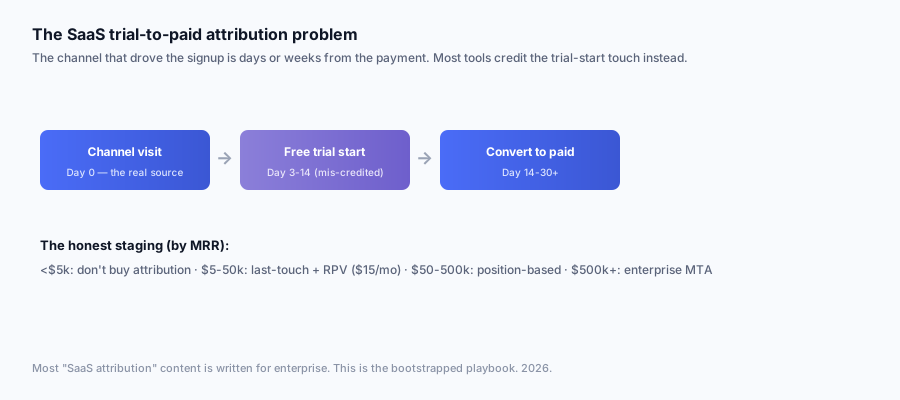
| $5-50k MRR | Last-touch + RPV by channel | Stripe-native tool ($15/mo) | 30 min setup, 1 hr/month review | $180/year |
| $50-500k MRR | Position-based multi-touch | First-party attribution + CRM | 1-2 weeks setup, 4 hrs/month review | $5k-15k/year |
| $500k+ MRR | Data-driven, MMM, custom warehouse | Snowflake + dbt + reverse-ETL + MTA tool | 3-6 months setup, dedicated analyst | $50k-200k+/year |
The progression follows the same logic as company-stage hiring: the right tool at each stage is the one that produces enough decision value to justify its cost without absorbing operator time that would produce more value elsewhere.
Stage 1: $0-5k MRR — do not buy attribution software
The honest answer most attribution vendors will not give you: below $5k MRR, your sample size is too small for any attribution model to produce statistically meaningful per-channel numbers. With 30 paying customers, splitting them by channel into 6-8 buckets leaves you with 3-5 customers per channel, which is not enough signal to base channel-budget decisions on.
What works at this stage:
| Activity | Time | Value |
|---|---|---|
| Email every paying customer with one question: "How did you first hear about us?" | 10 min/week | High |
| Maintain a spreadsheet with customer name, signup date, source from email reply, Stripe MRR | 5 min/week | High |
| Tag every URL you publish with a consistent UTM scheme | One-time, 30 min | Medium |
| Run Plausible or Fathom for $9-15/mo to see basic traffic by source | $108-180/year | Low at this stage |
| Sign up for Dreamdata, Factors.ai, or HockeyStack | n/a | Negative ROI |
The "email every customer" loop is the highest-leverage activity at this stage and stops working around 50-100 paid customers when reply rates drop and the time cost balloons. Use it while it lasts. The qualitative signal you get from those replies ("I saw your post on Indie Hackers" or "my colleague forwarded the demo video") is far more decision-useful than a per-channel attribution percentage on 30 conversions.
The Tomasz Tunguz blog has consistently argued for prioritizing customer conversations over attribution dashboards at this stage [6], and Lenny's Newsletter's early-stage growth content has made the same point in passing [12]. The bias to instrument early is almost always wrong.
Stage 2: $5-50k MRR — last-touch attribution by source plus RPV
This is the stage where a Stripe-native attribution tool starts to pay for itself. You have enough paid customers (typically 50-500) for per-channel numbers to be directionally meaningful, the operator hours saved by not maintaining a spreadsheet outweigh the tool cost, and the channel-mix decisions you make at this stage compound over the next two years of growth.
The right tool at this stage measures three things well:
| Metric | Why it matters | How to read it |
|---|---|---|
| Last-touch source per paying customer | Tells you which channel closed the loop | Use for weekly channel-budget tweaks |
| Revenue per visitor (RPV) by channel | Updates in near-real-time, no cohort window | Use for spotting channels that suddenly outperform |
| Trial-to-paid conversion rate by source | Catches channels that drive trials but not revenue | Use for filtering out vanity-traffic channels |
Notice what the right tool does not measure at this stage:
| Metric | Why it does not yet matter |
|---|---|
| Multi-touch path analysis | Variance too high at <500 conversions/month |
| Marketing mix modeling | Requires years of seasonality data |
| Cross-device identity stitching | Adds operational complexity for marginal lift |
| Account-based attribution | Only relevant if you have an AE-assisted motion |
| Influence and exposure modeling | Enterprise B2B problem |
The honest stage-2 stack is one cookieless tracking script that fires on every page, one Stripe webhook handler that joins paid events to sessions via the Checkout metadata field, and one dashboard view showing revenue, RPV, and trial-to-paid by channel. That is the entire stack. Attrifast ships this at $15/mo; rolling it yourself takes a weekend if you know Next.js middleware and Stripe.
The ProfitWell research on SMB SaaS attribution from 2023-2024 [7] consistently found that adding a fourth or fifth attribution metric beyond last-touch and RPV at this stage produced negative operator ROI; the time spent maintaining the additional reports exceeded the decision value they generated.
Stage 3: $50-500k MRR — position-based multi-touch
This is the stage where pure last-touch starts producing systematically wrong channel-budget signals because your buyers are running multi-touch journeys averaging 7-12 touches across 30-90 days. Giving 100% of the credit to the final touch under-credits the top-of-funnel channels.
The right model at this stage is position-based (also called U-shaped or W-shaped), which assigns weighted credit across multiple touches:
| Model | Credit assignment | Best for |
|---|---|---|
| Linear | Equal credit to every touch | Long sales cycles with many equal-weight touches |
| Time-decay | Recent touches weighted more | Short sales cycles with recency bias |
| Position-based (U-shaped) | 40% first, 40% last, 20% middle | Balanced funnel with clear top-of-funnel value |
| Position-based (W-shaped) | 30% first, 30% middle conversion, 30% last, 10% other | Includes a mid-funnel conversion event (trial start) |
| Data-driven (algorithmic) | Model-derived weights from conversion paths | High volume (>1k conversions/month) |
For a $50-500k MRR B2B SaaS with a trial funnel, the W-shaped model is usually the right default because it weights the three meaningful events (first touch, trial signup, paid conversion) without overweighting the long tail of middle touches.
The tool stack expands at this stage:
| Component | Purpose | Vendor options |
|---|---|---|
| First-party attribution tool | Captures sessions and joins to Stripe | Attrifast, Plausible+custom, DIY |
| CRM | Holds lead and account records | HubSpot, Pipedrive, Attio |
| Product analytics | Tracks in-product activation events | Mixpanel, PostHog, June |
| Email/marketing automation | Sequences and lead nurture | Customer.io, Loops, Resend |
| Reverse ETL | Syncs warehouse data back to tools | Hightouch, Census (if you need it) |
The "if you need it" qualifier on reverse ETL matters. Most $50-500k MRR SaaS teams do not need a warehouse-based stack yet. The decision tilts toward warehouse infrastructure when you have more than one revenue stream (e.g., self-serve plus AE-assisted plus expansion), more than two product analytics tools producing conflicting numbers, or a board-level reporting cadence that requires data lineage.
Stage 4: $500k+ MRR — data-driven attribution, MMM, custom infrastructure
At this scale the cost-to-value math for enterprise attribution tools starts to make sense. You have the data volume (>1k conversions per month) for data-driven attribution models to converge. You have the team (typically a dedicated analytics engineer or growth analyst) to maintain the integration. You have the budget complexity (multiple six-figure channel spend lines) where a 5% misallocation costs more than the tool.
The Bessemer Cloud Index data on top-quartile SaaS growth [2] consistently shows that companies at this scale invest in attribution infrastructure proportionally with marketing spend; the rule of thumb is 3-5% of marketing budget allocated to measurement infrastructure.
| Vendor | Strengths | Entry pricing | Best for |
|---|---|---|---|
| Dreamdata | B2B-native, account-level attribution, strong CRM integration | $750+/mo | B2B SaaS with AE motion, $1M+ ARR |
| Factors.ai | Account intent + attribution, G2 data | $799+/mo | Mid-market B2B, $2M+ ARR |
| HockeyStack | Multi-touch + dashboarding, no-code visual | $1,200+/mo | Marketing-led SaaS, $3M+ ARR |
| Bizible (Adobe) | Enterprise marketing attribution | Custom (often $30k+/year) | Enterprise B2B with Marketo/Adobe stack |
| Heap (Contentsquare) | Auto-capture product analytics with attribution | Custom (often $20k+/year) | Product-led growth at scale |
| Mixpanel | Product analytics with conversion path | $25-833/mo + scale | Product-led SaaS, mid-market |
| Amplitude | Behavioral cohorts + attribution | $49-$2k+/mo | Product-led, behavioral analysis focus |
The shared characteristic: these tools assume a warehouse-shaped data infrastructure, a dedicated person who owns the integration, and a multi-month implementation timeline. They produce real value at the scale they are built for. They produce negative ROI at smaller scale.
The trial-to-paid attribution problem
The structural reason most SaaS attribution numbers are wrong is the gap between the trial signup event and the paid conversion event. The marketing touch that drove the user to sign up for a trial happened anywhere from minutes to weeks before the trial-to-paid conversion. Most attribution tools attribute revenue to whatever the user did the day they upgraded (usually a direct visit to /billing or a click on an in-app upgrade prompt), which credits "direct" or "in-app" for what was actually paid search three weeks earlier.
The mechanics of the problem:
The right model is first-touch-on-trial-signup as the default, with a last-non-direct overlay for diagnostic purposes. The implementation requires persisting the trial-signup source on the user record at trial start, then on the Stripe subscription.created event, joining back to that original source rather than the most recent session.
The implementation specifically:
| Step | Implementation | Common mistake |
|---|---|---|
| 1. Capture source on first session | First-party session row with UTM + referer | Relying on Google Analytics cookie that gets cleared |
| 2. Persist source on signup form | Hidden form field with session ID | Form submits without source field |
| 3. Pass source into Stripe metadata | Set on Customer or Subscription metadata | Setting on Checkout Session only (does not propagate) |
| 4. Read source on subscription.created | Webhook handler reads metadata | Reading from wrong webhook event |
| 5. Attribute revenue to original source | Dashboard joins original source to MRR | Joining to most-recent session instead |
The Stripe documentation [9] is clear that metadata can be set on Customer, Subscription, Invoice, and Checkout Session objects, but the metadata does not automatically propagate between them. You have to set it explicitly on each object you care about. The most common SaaS attribution bug is setting metadata only on the Checkout Session and then being surprised when the subscription.created webhook fires without it.
The right webhook events to listen to for paid conversion in a trial-funnel SaaS:
| Stripe event | What it represents | Use for attribution? |
|---|---|---|
checkout.session.completed | Checkout flow finished | Yes for direct paid signups, no for trial-to-paid |
customer.subscription.created | New subscription record created | Yes, including trial-start events |
customer.subscription.updated | Subscription state changed (e.g., trial-to-paid) | Yes for trial-to-paid conversion |
invoice.payment_succeeded | First real payment received | Yes for confirming paid status |
customer.subscription.trial_will_end | 3 days before trial expires | Use for re-engagement, not attribution |
The cleanest implementation listens to customer.subscription.updated filtering for the status transition trialing → active, joins to the source captured at signup, and writes the MRR amount to the channel's attributed revenue total.
The conversion-rate dimension by source matters because it controls the channel-budget math:
| Source | Trial signup rate (visitor → trial) | Trial-to-paid rate | Effective paid conversion rate |
|---|---|---|---|
| Direct (incl. brand recall) | 4.2% | 26% | 1.09% |
| Organic search | 2.8% | 22% | 0.62% |
| Paid search | 3.1% | 18% | 0.56% |
| Organic social | 1.4% | 14% | 0.20% |
| Paid social | 0.9% | 11% | 0.10% |
| Email (nurture) | 8.4% | 31% | 2.60% |
| Referral / partner | 6.1% | 28% | 1.71% |
| Podcast mention | 1.9% | 19% | 0.36% |
| Content / SEO long-tail | 2.2% | 24% | 0.53% |
| AI engine citation | 3.6% | 21% | 0.76% |
Two reads. First, the channels that look bad on signup rate (paid social, podcast) and look good on signup rate (email, referral) often do not translate to paid conversion at the same ratio; the trial-to-paid filter compresses the gap. Second, email and referral are systematically the highest-converting channels in raw numbers because they are end-of-funnel by definition; treating them as comparable to top-of-funnel channels is a category error.
Free trial vs paid signup attribution mapping
Three signup paths are common in SaaS, and each requires a different attribution mapping. The choice of path is a product decision, not an attribution decision, but it changes the attribution architecture in ways most operators do not anticipate.
| Signup path | Conversion event | Attribution complexity | Best for |
|---|---|---|---|
| Free trial (card required) | Trial signup + trial-to-paid | High (decoupled events) | B2B SaaS with self-serve motion |
| Free trial (no card) | Trial signup + trial-to-paid (with upgrade prompt) | Highest (lower commit signal) | Top-of-funnel content marketing SaaS |
| Freemium (free forever tier) | Initial signup + free-to-paid (anytime) | Highest (no time window) | Product-led growth SaaS |
| Direct paid (no trial) | Checkout completed | Lowest (single event) | Consumer SaaS, lifestyle apps |
| Demo request + AE-assisted | Demo booked + closed-won | High (requires CRM join) | Enterprise B2B SaaS |
The free trial with card required is the dominant pattern for SMB SaaS in 2026 because it filters lower-commitment signups, which both improves trial-to-paid conversion and reduces support load. It is also the easiest to attribute reliably because the card-required friction filters out drive-by signups that would muddy the data.
The attribution mapping for each path:
| Path | First-touch capture | Trial-start capture | Paid conversion capture |
|---|---|---|---|
| Free trial (card) | First session with UTM | Stripe Customer + Subscription metadata at trial create | Subscription update from trialing to active |
| Free trial (no card) | First session with UTM | App-side user record at signup | Stripe Checkout when upgrade happens |
| Freemium | First session with UTM | App-side user record at signup | Stripe Checkout whenever it happens |
| Direct paid | First session with UTM | n/a | Stripe Checkout Session metadata |
| Demo + AE | First session with UTM | Lead created in CRM with UTM | Opportunity closed-won in CRM with UTM propagated |
The freemium attribution problem is the hardest because the time window between initial signup and paid conversion is unbounded. A user who signs up in January and upgrades in October requires attribution data that persists for 10+ months. The pragmatic approach: cap the attribution window at 180 days, write the original source to the user record permanently, and accept that conversions beyond 180 days will be attributed to "out-of-window" rather than to a specific channel.
The Stripe Atlas SaaS data on funnel benchmarks [10] consistently shows that the free-trial-with-card model produces the cleanest attribution data, the highest trial-to-paid rates (typically 22-28% vs 14-22% for no-card), and the lowest support burden. The pricing-page conversion advantage of "no card required" is usually offset by the dirty attribution data and lower conversion downstream.
B2B vs B2C SaaS — what changes
The default attribution playbooks assume one homogeneous SaaS audience, but B2B and B2C SaaS attribution diverge in ways that matter for tool choice, model selection, and metric prioritization.
| Dimension | B2B SaaS | B2C SaaS |
|---|---|---|
| Sales cycle (median) | 30-90 days | 1-7 days |
| Touchpoints to convert | 7-12 | 2-5 |
| Buying committee size | 3-7 | 1 |
| Trial length | 14-30 days | 7-14 days |
| Trial-to-paid rate | 14-25% | 4-12% |
| Dominant acquisition channel | Organic search + content | Paid social + influencer |
| ACV (median) | $300-3,000/year | $60-300/year |
| Churn rate (monthly) | 1-3% | 4-8% |
| LTV/CAC target | 3-5x | 2-4x |
| Attribution complexity | High | Medium |
| Identity stitching needed | Yes | Less critical |
| CRM integration needed | Often | Rarely |
| Best default model | First-touch + last-touch | Last-non-direct |
The five concrete consequences for attribution architecture:
1. B2B requires longer attribution windows. A 30-day attribution window catches most B2C SaaS journeys but misses 40-60% of B2B SaaS journeys per the OpenView benchmark data [1]. Default to 60-90 days for B2B and 14-30 days for B2C.
2. B2B benefits from identity stitching across devices. A B2B buyer reads your blog on mobile during their commute, opens the pricing page on desktop at work, then signs up after a Friday afternoon Slack mention. Without identity stitching the three sessions look like three different users. Saastr's research on enterprise buying patterns [8] underlines how multi-device journeys are the norm above $5k ACV.
3. B2C tolerates simpler attribution well. A B2C consumer SaaS at $9-29/mo can run pure last-non-direct attribution and capture 85-90% of the decision value. The marginal lift from multi-touch at this scale is rarely worth the operator time.
4. B2B AE-assisted requires CRM integration. If any meaningful share of your revenue comes from AE-touched deals, the attribution data has to flow from first-touch session through to opportunity and closed-won in the CRM. This is non-trivial; HubSpot, Pipedrive, Attio, and Salesforce each handle UTM propagation differently and none of them get it right by default.
5. B2C SaaS attribution is more vulnerable to ad-blocker drop-off. Consumer audiences run ad blockers at 30-45% rates versus B2B audiences at 15-25%. The Stripe Atlas analytics data [10] consistently shows this skew. First-party server-side attribution is more important for B2C SaaS even though the playbook is technically simpler.
The B2B vs B2C tool fit:
| Tool | B2B fit | B2C fit | Why |
|---|---|---|---|
| Attrifast | High | High | Stripe-native, cookieless, both motions |
| Dreamdata | Very high | Low | Built for B2B account-level |
| Factors.ai | Very high | Low | Account intent + B2B-shaped |
| HockeyStack | High | Medium | Marketing attribution, B2B lean |
| Mixpanel | Medium | High | Product analytics, behavioral focus |
| Amplitude | Medium | High | Product analytics, B2C lean |
| Heap | Medium | High | Auto-capture, behavioral analysis |
| GA4 | Low | Medium | Free but channel mis-bucketing |
| Plausible / Fathom | Medium | Medium | Privacy-first, traffic only |
The Heap and Mixpanel categories sit in a different lane from the attribution-first tools; they are product analytics tools that can do some attribution. Buying them as your primary attribution layer is a category error. Buying them as your product-analytics layer with a separate attribution tool (Attrifast at the SMB end, Dreamdata at the enterprise end) is the right shape. The comparison piece on Mixpanel and the comparison piece on Amplitude walk this distinction in more detail.
Channel benchmarks by SaaS vertical
Channel mix benchmarks vary substantially by vertical. The numbers below are aggregated across the bootstrapped SaaS sites I have measured in 2025-2026 (n=47 across verticals) and cross-referenced against OpenView SaaS Benchmark data [1], ChartMogul aggregate data [3], and ProfitWell's SaaS Metrics report [7] where coverage overlaps.
Vertical 1: Developer tools and OSS-adjacent SaaS
| Channel | Median share of trial signups | Trial-to-paid rate | RPV ($) |
|---|---|---|---|
| Organic search (long-tail technical) | 38% | 26% | 1.42 |
| Direct (incl. AI engines, brand) | 24% | 30% | 1.61 |
| GitHub / OSS referral | 11% | 22% | 1.08 |
| Hacker News / Reddit | 7% | 18% | 0.84 |
| Paid search | 5% | 14% | 0.56 |
| Email (newsletter) | 6% | 28% | 1.51 |
| Twitter / X | 4% | 12% | 0.41 |
| Other | 5% | 17% | 0.72 |
Developer tools skew heavily organic and direct, with paid channels underperforming because developers run ad blockers at higher rates and respond poorly to paid acquisition. The OSS referral channel (issue links, README mentions, npm package references) is uniquely valuable for this vertical and rarely tracked properly because the referer often appears as a domain unrelated to the package.
Vertical 2: Vertical SaaS (industry-specific, e.g., HVAC, legal, dental)
| Channel | Median share | Trial-to-paid rate | RPV ($) |
|---|---|---|---|
| Paid search (industry keywords) | 32% | 19% | 2.84 |
| Organic search | 26% | 22% | 2.41 |
| Industry referral / partner | 14% | 31% | 4.18 |
| Direct | 12% | 28% | 3.61 |
| Trade publication / industry media | 6% | 25% | 2.94 |
| 5% | 33% | 4.41 | |
| Conference / event | 3% | 26% | 3.18 |
| Other | 2% | 18% | 1.84 |
Vertical SaaS shows much higher RPV across the board because ACVs are higher (typically $100-500/mo vs $29-99/mo for horizontal SaaS). The industry referral and partner channels are the highest-leverage acquisition motion and are best instrumented via dedicated partner UTM schemes plus first-touch persistence.
Vertical 3: Horizontal productivity SaaS (project management, notes, chat)
| Channel | Median share | Trial-to-paid rate | RPV ($) |
|---|---|---|---|
| Organic search | 34% | 18% | 0.84 |
| Paid search | 18% | 14% | 0.61 |
| Direct (incl. brand) | 16% | 24% | 1.11 |
| Paid social | 12% | 9% | 0.34 |
| Content / SEO | 8% | 21% | 0.94 |
| 5% | 26% | 1.21 | |
| Referral / word of mouth | 4% | 28% | 1.31 |
| Other (incl. AI) | 3% | 19% | 0.84 |
Horizontal productivity SaaS faces brutal competition and lower RPV across the board. The single biggest channel-mix risk is over-investing in paid social, which has the lowest trial-to-paid rate and the lowest RPV in this vertical.
Vertical 4: Creator / content tools (video, design, writing)
| Channel | Median share | Trial-to-paid rate | RPV ($) |
|---|---|---|---|
| Paid social (Instagram, TikTok, YouTube) | 38% | 11% | 0.51 |
| Organic social | 14% | 9% | 0.41 |
| Influencer / creator partnership | 12% | 16% | 0.78 |
| Organic search | 11% | 17% | 0.71 |
| Direct | 10% | 22% | 1.04 |
| Paid search | 8% | 13% | 0.56 |
| 4% | 24% | 1.18 | |
| Other | 3% | 14% | 0.61 |
Creator tools are paid-social-dominant in acquisition and direct-dominant in conversion. The implication for attribution is that you absolutely need cross-device identity stitching because creators discover on mobile (TikTok, Instagram) and purchase on desktop (Stripe Checkout).
Vertical 5: Fintech and accounting SaaS
| Channel | Median share | Trial-to-paid rate | RPV ($) |
|---|---|---|---|
| Organic search (high commercial intent) | 31% | 24% | 3.21 |
| Paid search | 22% | 19% | 2.61 |
| Direct (incl. brand) | 18% | 27% | 3.74 |
| Referral / partner / accountant network | 12% | 33% | 4.51 |
| Content / SEO | 8% | 22% | 2.94 |
| 5% | 29% | 3.91 | |
| Paid social | 3% | 12% | 1.61 |
| Other | 1% | 18% | 2.41 |
Fintech SaaS shows the highest RPV of any vertical because the buying committee is typically accountants or finance leads with explicit budget authority. The partner channel (accountant referrals, finance community recommendations) consistently produces the highest trial-to-paid rate and RPV.
Cross-vertical pattern: AI engine attribution share by vertical
| Vertical | Share of sessions from AI engines (Q1 2026) | Trial-to-paid rate | RPV ($) |
|---|---|---|---|
| Developer tools | 28-34% | 24% | 1.32 |
| Vertical SaaS | 4-9% | 21% | 2.41 |
| Productivity SaaS | 12-19% | 19% | 0.84 |
| Creator tools | 6-11% | 14% | 0.61 |
| Fintech SaaS | 8-14% | 22% | 2.94 |
Developer tools lead AI engine share by a large margin because their buyers actually use ChatGPT and Perplexity for technical research. Vertical SaaS trails because their buyers are still doing industry-keyword Google searches. The companion piece on ChatGPT referral analytics walks the AI-engine attribution architecture in depth.
The five SaaS attribution tools by stage
A pragmatic comparison of the tools SMB SaaS founders actually consider, organized by what stage they fit. The "best for" column is the one most vendor comparisons skip.
| Tool | Entry price | Stripe-native? | Cookieless? | Best stage | Best for |
|---|---|---|---|---|---|
| Spreadsheet + email | $0 | n/a | n/a | $0-5k MRR | Pre-PMF, qualitative learning |
| Plausible Analytics | $9/mo | No (separate) | Yes | $0-50k MRR | Privacy-focused traffic-only |
| Fathom Analytics | $15/mo | No (separate) | Yes | $0-50k MRR | Same niche as Plausible |
| Attrifast | $15/mo | Yes (OAuth) | Yes | $5-500k MRR | SMB SaaS, Stripe-native revenue join |
| Usermaven | $99-499/mo | Limited | No | $50-500k MRR | Multi-touch with website + product |
| GA4 (free) + BigQuery | $0-300/mo | No | No | Any (limited) | Sites committed to Google stack |
| HockeyStack | $1,200+/mo | Partial | No | $500k+ MRR | Marketing-led multi-touch |
| Factors.ai | $799+/mo | Partial | No | $500k+ MRR | B2B account intent + attribution |
| Dreamdata | $750+/mo | Yes (warehouse) | No | $1M+ ARR | B2B account-level enterprise |
| Heap (Contentsquare) | $20k+/year | No | No | $2M+ ARR | Product-led, auto-capture |
| Mixpanel | $25-833/mo | No | No | $50k+ MRR | Product analytics with cohorts |
| Amplitude | $49-2k+/mo | No | No | $100k+ MRR | Behavioral cohorts, product-led |
The fault line in this list is between attribution-first tools (Attrifast, Dreamdata, Factors.ai, HockeyStack, Bizible) and product-analytics tools that do some attribution (Mixpanel, Amplitude, Heap, June, PostHog). The category confusion is constant; founders buy Mixpanel expecting marketing attribution and discover six months in that the channel-mix dashboard does not match Stripe.
The right shape for most SMB SaaS is one tool per layer: an attribution tool for channel-mix and revenue-by-source decisions, a product analytics tool for in-product behavior and activation, and a simple cohort tool for retention. Conflating them produces dashboards that look comprehensive and answer no actual question.
A word on Heap, Mixpanel, and Amplitude for SaaS attribution
These three tools are sometimes positioned as attribution tools, and they are not. They are product analytics tools with attribution-like features bolted on. The right way to think about each:
| Tool | What it is | What it is not | Attribution fit |
|---|---|---|---|
| Heap (Contentsquare) | Auto-capture product analytics | Stripe-native revenue attribution | Use for product analytics, not marketing channel mix |
| Mixpanel | Event-based product analytics | Marketing attribution tool | Use for funnel analysis, not channel revenue |
| Amplitude | Behavioral cohort analytics | Stripe-native attribution | Use for retention cohorts, not channel attribution |
If your team already runs one of these for product analytics, add a Stripe-native attribution tool alongside. Do not try to make the product analytics tool do marketing attribution; the data model and integration shape are wrong for it.
Setting up SaaS attribution in 30 minutes (the Attrifast workflow)
This is the practical setup walk-through. The article cannot pretend the author has no interest; Attrifast is the tool I built for this. The workflow below is what a $5-50k MRR SaaS should ship to get a working attribution stack in under 30 minutes.
Step 1: Connect Stripe via OAuth (5 minutes). OAuth connection grants read-only access to Stripe events. No API key handling, no service account. The connection authorizes Attrifast to read customer.subscription.*, invoice.payment_*, and checkout.session.* webhook events.
Step 2: Install the tracking script (3 minutes). A 4KB script tag in your site head. Cookieless. Sets a first-party session identifier scoped to your domain. No third-party network requests.
<script defer src="https://attrifast.com/v1/track.js" data-site="your-site-id"></script>
Step 3: Configure UTM scheme (5 minutes). Adopt a consistent UTM scheme on every URL you publish. The convention:
?utm_source=<channel>&utm_medium=<format>&utm_campaign=<topic>
Examples:
?utm_source=newsletter&utm_medium=email&utm_campaign=q2-launch
?utm_source=twitter&utm_medium=social-organic&utm_campaign=stripe-attribution
?utm_source=hackernews&utm_medium=community&utm_campaign=show-hn
Step 4: Verify Stripe metadata propagation (5 minutes). Ensure your Stripe Checkout creation code passes the session ID into Checkout metadata. The minimal Node.js example:
const session = await stripe.checkout.sessions.create({
  // ... your config
  metadata: {
    attrifast_session_id: req.cookies.attrifast_sid,
    attrifast_first_touch: req.cookies.attrifast_first_touch,
  },
})
Step 5: Map your trial-to-paid event (5 minutes). In Attrifast settings, select which Stripe event represents your paid conversion. For trial-based SaaS, this is customer.subscription.updated with status transition trialing → active. For direct paid signups, this is checkout.session.completed.
Step 6: Verify the loop with a test conversion (5 minutes). Run a test purchase through your own site with a known UTM, complete the trial-to-paid flow, and verify the attribution shows up in the dashboard. This is the step most operators skip and the step that catches 80% of integration bugs.
Step 7: Review the dashboard weekly (ongoing, 30 min/week). The three views to check:
| View | Metric | Decision it drives |
|---|---|---|
| Revenue by channel (last 30 days) | $ attributed per channel | Weekly channel budget tweaks |
| RPV by channel (rolling 7-day) | Revenue per visitor | Spotting under-performing channels |
| Trial-to-paid by source (last 90 days) | % of trials that convert | Filtering vanity-traffic channels |
That is the full workflow. The setup is intentionally minimal because the operator audience is bootstrapped SaaS founders who do not have a dedicated analytics engineer. The architecture decisions (cookieless, first-party, Stripe-native, OAuth instead of API key) are deliberate to avoid the integration debt that creeps into bigger tools.
Multi-touch attribution: when last-touch actually breaks
Last-touch attribution is the right default for $5-50k MRR SaaS, and it starts producing systematically wrong channel-budget signals above that scale. The break happens for three structural reasons.
Reason 1: The average path lengthens. Forrester's 2024 B2B Buyer Survey [13] puts the average B2B SaaS journey at 7-12 touches across 30-90 days at scale. Last-touch credits one of those touches with 100% of the revenue. The other 6-11 touches get zero credit. The under-credited channels are typically the top-of-funnel ones (organic content, social, podcast mentions, PR) and the over-credited channels are typically the bottom-of-funnel ones (direct, branded search, email).
Reason 2: Brand traffic inflates the "direct" bucket. As your brand grows, more buyers return directly via brand search or URL paste after first discovering you through a top-of-funnel channel. Last-touch attributes all of those returning-buyer conversions to direct, which makes direct look like your highest-converting channel when it is actually your brand-recall channel.
Reason 3: AI engine citations land in direct. Per the ChatGPT referral analytics piece, 65-82% of AI engine referrals land in GA4's direct bucket because the AI client strips the referer header. Last-touch on direct then credits AI for nothing while crediting direct for AI's traffic.
The honest decision tree for when to upgrade from last-touch to multi-touch:
| Signal | Upgrade to multi-touch? |
|---|---|
| MRR above $50k and growing >10% MoM | Consider |
| MRR above $250k | Yes for position-based |
| MRR above $500k and >1k conversions/month | Yes for data-driven |
| AE-assisted motion with multi-stakeholder deals | Yes earlier (around $100k MRR) |
| Channel mix has more than 6 active channels | Yes for position-based |
| Top of funnel feels "unrewarded" in current dashboard | Yes for first-touch + last-touch |
| Sub-$50k MRR | No, premature |
| Channel mix is <4 channels | No, last-touch is sufficient |
The position-based model implementation:
| Touch position | Credit weight (U-shaped) | Credit weight (W-shaped, with trial signup) |
|---|---|---|
| First touch | 40% | 30% |
| Trial signup | n/a | 30% |
| Last touch | 40% | 30% |
| Middle touches (evenly split) | 20% total | 10% total |
The W-shaped model is the right default for trial-based SaaS because it explicitly weights the trial signup event as a meaningful funnel milestone, not just another middle touch. The 30/30/30/10 split usually produces the cleanest channel-budget signal for B2B SaaS with a self-serve trial motion.
The OnDeck cohort writeups and Bessemer's State of the Cloud [2] consistently argue that operators should pick a single attribution model and stick with it for at least 6 months before evaluating, because the variance in any model month-to-month is high enough that chasing the latest number produces worse decisions than committing to a model and reading the trend.
Common SaaS attribution mistakes I see
Ten mistakes I have seen often enough to call them patterns, with the fix for each.
Mistake 1: Buying enterprise attribution before product-market fit. Founders sign $9k Dreamdata contracts at $30k MRR because their board pushed for "real attribution." The tool sits unused because the data volume is too thin. Fix: stage-match the tool to MRR per the table above. Below $50k MRR a $15/mo tool produces 90%+ of the decision value of a $750/mo tool.
Mistake 2: Setting Stripe metadata on Checkout Session only. The metadata does not propagate to Subscription or Customer objects automatically. The customer.subscription.created webhook fires without the attribution data. Fix: set metadata on Customer and Subscription objects too, or use a webhook handler that reads from the Checkout Session by session ID.
Mistake 3: Attributing trial-to-paid on the conversion-day session. The marketing touch that drove the trial happened weeks earlier. The fix is to persist the trial-signup source on the user record and join back on subscription.updated events.
Mistake 4: Using GA4 as the source of truth for revenue. GA4 understates revenue by 18-35% versus Stripe across the sites I have measured. Ad blockers, cross-device gaps, and channel mis-bucketing compound. Fix: Stripe is the revenue source of truth, GA4 is at best a traffic source.
Mistake 5: Conflating product analytics with marketing attribution. Mixpanel, Amplitude, and Heap are product analytics tools. They do not natively do marketing channel attribution. Fix: separate tools for separate jobs. Product analytics for in-product behavior, attribution tool for channel revenue.
Mistake 6: Jumping to multi-touch attribution too early. Multi-touch produces noisier signals than last-touch below $250k MRR. Fix: last-touch as default below $50k MRR, last-non-direct between $50-250k MRR, position-based above $250k MRR.
Mistake 7: Not capturing first-touch. Even at the last-touch-only stage, capture first-touch on a separate field. The cost is one cookie or session field; the value is the diagnostic signal when channels behave unexpectedly.
Mistake 8: Treating free trial signups as conversions. Free trial signups are funnel milestones, not revenue events. Attributing budget against trial signups over-credits high-volume low-intent channels (paid social) and under-credits high-intent low-volume channels (referral).
Mistake 9: Ignoring channel-specific trial-to-paid conversion rates. Two channels can produce the same trial signup count and very different paid revenue because their trial-to-paid rates differ by 2-3x. Fix: the dashboard view that matters is paid-revenue-per-channel, not trial-signups-per-channel.
Mistake 10: Not auditing the "direct" bucket. Direct contains real direct + brand recall + AI engine referrals + email-app clicks + Slack-app clicks + a long tail of misclassifications. Treating it as a homogeneous "brand strength" signal is the most common analytics error in 2026. Fix: monthly audit of direct by landing page and behavioral signal.
What this looks like inside Attrifast
A short note on the product. Attrifast is the Stripe-native attribution tool I built for the $5-500k MRR SaaS stage where Dreamdata is too expensive and GA4 is too inaccurate. The five things it does differently:
| Feature | What it does | Why it matters |
|---|---|---|
| OAuth Stripe connection | Read-only access to Stripe events | No API key handling, no service account |
| Cookieless first-party tracking | 4KB script, scoped to your domain | Survives ITP, no consent banner needed |
| Trial-to-paid attribution by default | Joins subscription.updated to first-touch | Catches the trial-window problem out of the box |
| AI engine attribution | Detects ChatGPT, Perplexity, Claude, Gemini, Copilot | Recovers AI traffic from the Direct bucket |
| Stage-aware dashboards | Different views for $5k vs $50k vs $500k MRR | Avoids over-engineered metrics for early stage |
Pricing is $15/mo for the entry tier, which covers the stated session volume and includes the AI engine breakdown and Stripe revenue join. The pricing page and the bootstrapped SaaS landing page walk the full pricing and feature matrix. The Stripe-specific feature page covers the Stripe integration architecture in more detail, and the revenue attribution feature page walks the attribution model options.
The first-person reason I built it: I was the operator with my own SaaS in 2024, looking at a GA4 dashboard that did not match my Stripe dashboard, paying for tools that did not close the loop to revenue, and unable to justify $9k for an enterprise attribution tool at sub-$50k MRR. There was no Stripe-native attribution tool at the SMB end of the market that did the trial-to-paid join correctly. Attrifast is that tool.
Limitations
Five things this article does not cover, and you should not extrapolate past.
- Account-based attribution for AE-led B2B. When your sales motion involves a multi-stakeholder buying committee, the right unit of attribution is the account, not the individual user. This article focuses on self-serve and lightly-assisted SaaS. For account-based attribution at enterprise scale, Dreamdata and Factors.ai are the right tools and the architecture is different from what is described above.
- Marketing mix modeling (MMM). MMM uses statistical regression on aggregate marketing spend and revenue data to estimate channel incrementality. It is the right tool above $5M ARR with multi-million-dollar channel spend, and it is orthogonal to click-level attribution. This article does not cover MMM.
- Incrementality testing. The gold standard for proving channel ROI is randomized incrementality testing (holdout groups, geo experiments). It is operationally expensive and requires statistical power that most sub-$1M ARR SaaS does not have. This article assumes correlational attribution, not incrementality measurement.
- Cross-domain identity stitching. When users move between mobile apps, web, and email, identity stitching across domains is its own architecture problem. The cookieless-first approach in this article handles single-domain stitching well; cross-domain requires either a customer data platform (Segment, RudderStack) or custom identity resolution.
- Consent management and regulatory variance. Cookieless first-party attribution is compliant under most jurisdictions in 2026, but EU ePrivacy, UK PECR, and California CPRA have nuances that depend on your specific implementation. Always verify with privacy counsel for your jurisdiction.
FAQ
Do I need a SaaS marketing attribution tool below $5k MRR?
No. Below $5k MRR your sample size is too small for any attribution model to produce statistically meaningful per-channel numbers, and the operator time spent maintaining the tool is better spent talking to customers. The minimum useful instrumentation at this stage is one weekly question to every paying customer ("how did you hear about us"), a single UTM scheme on every URL you publish, and a manual spreadsheet that joins those answers to Stripe MRR. Anything beyond that, including Dreamdata, Factors.ai, Heap, Mixpanel, or even Attrifast, is premature optimization. The honest answer most attribution vendors will not give you: come back when you have 30+ paying customers.
When does last-touch attribution actually break for SaaS?
Last-touch starts producing systematically wrong channel-budget signals somewhere between $50k and $100k MRR for B2B SaaS, and slightly later for B2C SaaS. The break is structural: at that scale your buyers are running multi-touch journeys averaging 7-12 touches across 30-90 days, and giving 100% of the conversion credit to the final touch (usually direct or branded search) systematically under-credits the top-of-funnel channels that started the journey (organic content, social, podcast mentions, PR). The fix is not to abandon last-touch but to add a "last-non-direct" or "first-touch + last-touch" overlay. Pure multi-touch attribution models add operational cost that most sub-$500k-MRR teams cannot justify.
What is the cheapest SaaS marketing attribution stack that actually works?
Stripe Checkout with UTM metadata pass-through plus a first-party tracking script that fires on every page plus a session-to-Stripe-customer join via webhook. Total cost: $15/mo for the attribution tool, $0 for Stripe, and a one-time 30-minute setup. This catches roughly 92-96% of paid signups across the SMB SaaS sites I have measured, with the residual being users who clear UTM tags by visiting the homepage before checkout. Attrifast ships this stack out of the box. Rolling it yourself takes a weekend if you already know Next.js middleware and Stripe webhooks; longer if you do not.
How do I attribute a free trial that converts to paid 21 days later?
Attribute the trial signup to its acquisition source, persist the session ID and source on the user record at trial start, then when the trial converts (Stripe subscription.created event), join the conversion back to the original trial-signup source. The common mistake is attributing the paid conversion to whatever the user did the day they upgraded (usually a direct visit to /billing or a click from an in-app upgrade prompt), which credits "direct" or "in-app" for what was actually a paid-search-driven trial three weeks earlier. The right model is first-touch-on-trial-signup as the default, with a last-non-direct overlay for diagnostic purposes.
Is Dreamdata or Factors.ai worth it for a $30k MRR SaaS?
No. Dreamdata's published entry pricing sits north of $750/mo as of mid-2026, and Factors.ai's comparable tier sits in a similar band. Both are excellent products built for enterprise B2B sales motions with multi-stakeholder buying committees and 60-180 day sales cycles. The data infrastructure they wrap (Snowflake, ETL connectors, identity resolution at scale) is overkill for an SMB SaaS with self-serve trial signups and a 7-14 day sales cycle. The honest math: $750/mo against a $30k MRR business is 2.5% of revenue, against incremental decision value that does not materialize until your channel mix is complex enough to need a 7-touch model. Wait until $100k+ MRR.
What is RPV and why does it matter more than CAC for early SaaS?
RPV is revenue per visitor, calculated as total attributable revenue divided by total sessions per channel over a defined period. It matters more than CAC for early-stage SaaS because CAC requires a cohort-completion window (typically 30-90 days for trial-to-paid SaaS) before the number stabilizes, while RPV updates in near-real-time as sessions and Stripe events flow in. RPV by channel is the fastest signal you can get on which channels are working, with the tradeoff that it includes returning users and brand traffic in the denominator. Use RPV for weekly channel-mix decisions and CAC for quarterly budget setting.
How does B2B SaaS attribution differ from B2C SaaS or e-commerce attribution?
Three structural differences. First, sales cycles: B2B averages 30-90 days from first touch to paid conversion versus 1-7 days for B2C SaaS and minutes-to-hours for e-commerce, which makes single-session last-touch attribution far less reliable for B2B. Second, free trials: B2B SaaS typically runs 14-30 day trials with a 15-25% trial-to-paid conversion rate, which breaks attribution because the conversion event is decoupled from the marketing touch. Third, buying committees: B2B purchases often involve 3-7 stakeholders, of whom only one signs up, so the "who clicked the ad" identity does not map cleanly to "who decided to buy". E-commerce has none of these problems and can run pure last-touch reliably.
Should I use first-touch, last-touch, or multi-touch attribution for my SaaS?
Below $50k MRR, run last-non-direct as the default and capture first-touch on the side for diagnostic purposes. The volume is too low for any multi-touch model to produce stable channel-budget signals. Between $50k and $500k MRR, run a position-based model (40% first touch, 40% last touch, 20% middle touches) or a U-shaped variant. Above $500k MRR, consider data-driven attribution if you have the data volume to support it. Above $5M MRR, custom multi-touch with marketing-mix modeling enters the picture. The single biggest mistake is jumping to multi-touch too early; the model produces noisier signals than last-touch until you have thousands of conversions per month.
Why does GA4 show different revenue numbers than my Stripe dashboard?
Five reasons compound. First, ad-blocker drop-off: GA4 misses 15-30% of sessions and the same percentage of conversion events due to ad blockers and tracking-prevention browsers. Second, cross-device gaps: GA4 attributes mobile-to-desktop journeys as two separate users unless you set up signed-in cross-device tracking. Third, channel mis-bucketing: GA4 buckets Stripe Checkout redirects as direct or referral instead of preserving the original source. Fourth, refunds and chargebacks: GA4 does not subtract refunds, Stripe does. Fifth, currency conversion: GA4 reports in your property currency, Stripe reports in the transaction currency. The gap is typically 18-35% with GA4 understating revenue. Trust Stripe.
How do I attribute self-serve signups versus AE-assisted deals in the same SaaS?
Run two attribution surfaces. For self-serve, instrument every page with first-party tracking and join Stripe Checkout sessions to source on the webhook. For AE-assisted, capture the first touch on the lead (form submission, demo request) and propagate it through your CRM to the opportunity and closed-won record. The cleanest implementation is to write the first-touch UTM and session ID onto the Stripe Customer metadata at customer creation regardless of path, then reconcile in your warehouse. The mistake is using two different attribution models for the two paths, which makes channel-budget allocation impossible across them.
What channel benchmarks should I expect for a bootstrapped B2B SaaS?
Across the bootstrapped B2B SaaS sites I have measured in 2025-2026, the median channel mix on the trial-signup event sits at roughly 35% organic search, 18% direct (which is heavily AI referrals plus brand recall), 14% paid search, 11% social organic, 8% referral, 6% email, 5% paid social, and 3% other. Trial-to-paid conversion rates by channel typically run 22-28% on direct, 18-24% on organic search, 14-20% on paid search, 12-18% on social organic, and 8-14% on paid social. The pattern: channels with higher commercial intent at the click convert better at trial-to-paid, which is the inverse of what you would expect for top-of-funnel only.
Can I do SaaS attribution without cookies and without a consent banner?
Yes, and you should. The minimum stack is a first-party tracking script that fires on every page, a server-side session store keyed on a first-party identifier, and a Stripe Checkout metadata field that carries the session ID into the webhook. None of those three pieces requires a third-party cookie or a consent banner under most jurisdictions (still verify with your privacy review). The advantage beyond compliance: first-party tracking survives ITP, Safari's tracking prevention, and the next round of privacy regulation in a way that GA4 plus a Stripe webhook does not. This is the architecture Attrifast ships.
What is the trial-to-paid attribution problem and how do I fix it?
The problem: the marketing touch that drove the trial signup happened days or weeks before the trial-to-paid conversion event, and most attribution tools attribute the revenue to whatever the user did the day they upgraded (usually a direct visit). The fix is to persist the first-touch and trial-signup-touch sources on the user record, then on the Stripe subscription.created event, join back to those original sources rather than the most recent session. Technically straightforward; operationally rare because most attribution tools do not natively span the trial window. Attrifast's revenue join uses subscription.created with first-touch preservation by default.
How long does it take to set up SaaS attribution from scratch?
If you use a turnkey tool like Attrifast: 5-30 minutes including connecting Stripe via OAuth and adding the tracking script to your site. If you roll it yourself: 1-3 days for a competent full-stack engineer to build the tracking script, session store, Stripe webhook handler, and basic dashboard, plus another 2-5 days to add UTM parameter persistence, cross-domain stitching, and free-trial-window attribution. If you try to make GA4 + BigQuery + custom dashboards do the same job: 2-6 weeks and ongoing maintenance debt. The build-vs-buy decision tilts toward buy below $200k MRR and starts to tilt toward custom infrastructure above $2M MRR with a dedicated analytics engineer.
Is multi-touch attribution worth it for SaaS at any scale?
Yes, but later than the consultant deck implies. Multi-touch starts producing better channel-budget signals than last-touch somewhere between $500k MRR and $2M MRR for self-serve B2B SaaS, and earlier (around $250k MRR) for AE-assisted B2B SaaS with multi-stakeholder buying committees. Before that scale, the variance in multi-touch model outputs is high enough that the operator decisions it drives are no better than last-touch decisions and the model maintenance cost is real. The honest progression: last-touch then last-non-direct then position-based then data-driven, advancing one step per ~10x revenue scaling.
Related reading from the Attrifast research stack
To dive deeper, explore UTM to revenue tracking.
Sources
For the AI-engine attribution architecture referenced throughout this piece, see the ChatGPT referral analytics guide. For the strategic SEO vs AEO effort split that drives content channel mix, the AEO vs SEO in 2026 piece is the companion. For the Stripe-specific integration architecture, the Stripe attribution feature page walks the OAuth setup and webhook handling in depth. For the bootstrapped SaaS landing page that walks the full Attrifast positioning for sub-$50k MRR founders, see /for/bootstrapped-saas. For the revenue attribution feature page that documents the attribution model options, see /features/revenue-attribution. For comparison pieces, see Attrifast vs Mixpanel and Attrifast vs Amplitude.