Implementation Guide

Revenue tracking for SaaS: track every dollar to its marketing source

Vincent Ruan
Vincent RuanFounder, Attrifast ·

Your Stripe dashboard shows total MRR. Baremetrics or ChartMogul shows you churn cohorts. But neither tool can answer the question that determines where to invest your marketing budget next month: which specific channel brought the customers who are still paying you six months later? This guide covers the SaaS revenue metrics framework, the attribution stack, and the exact steps to connect every dollar of MRR to its original marketing source.
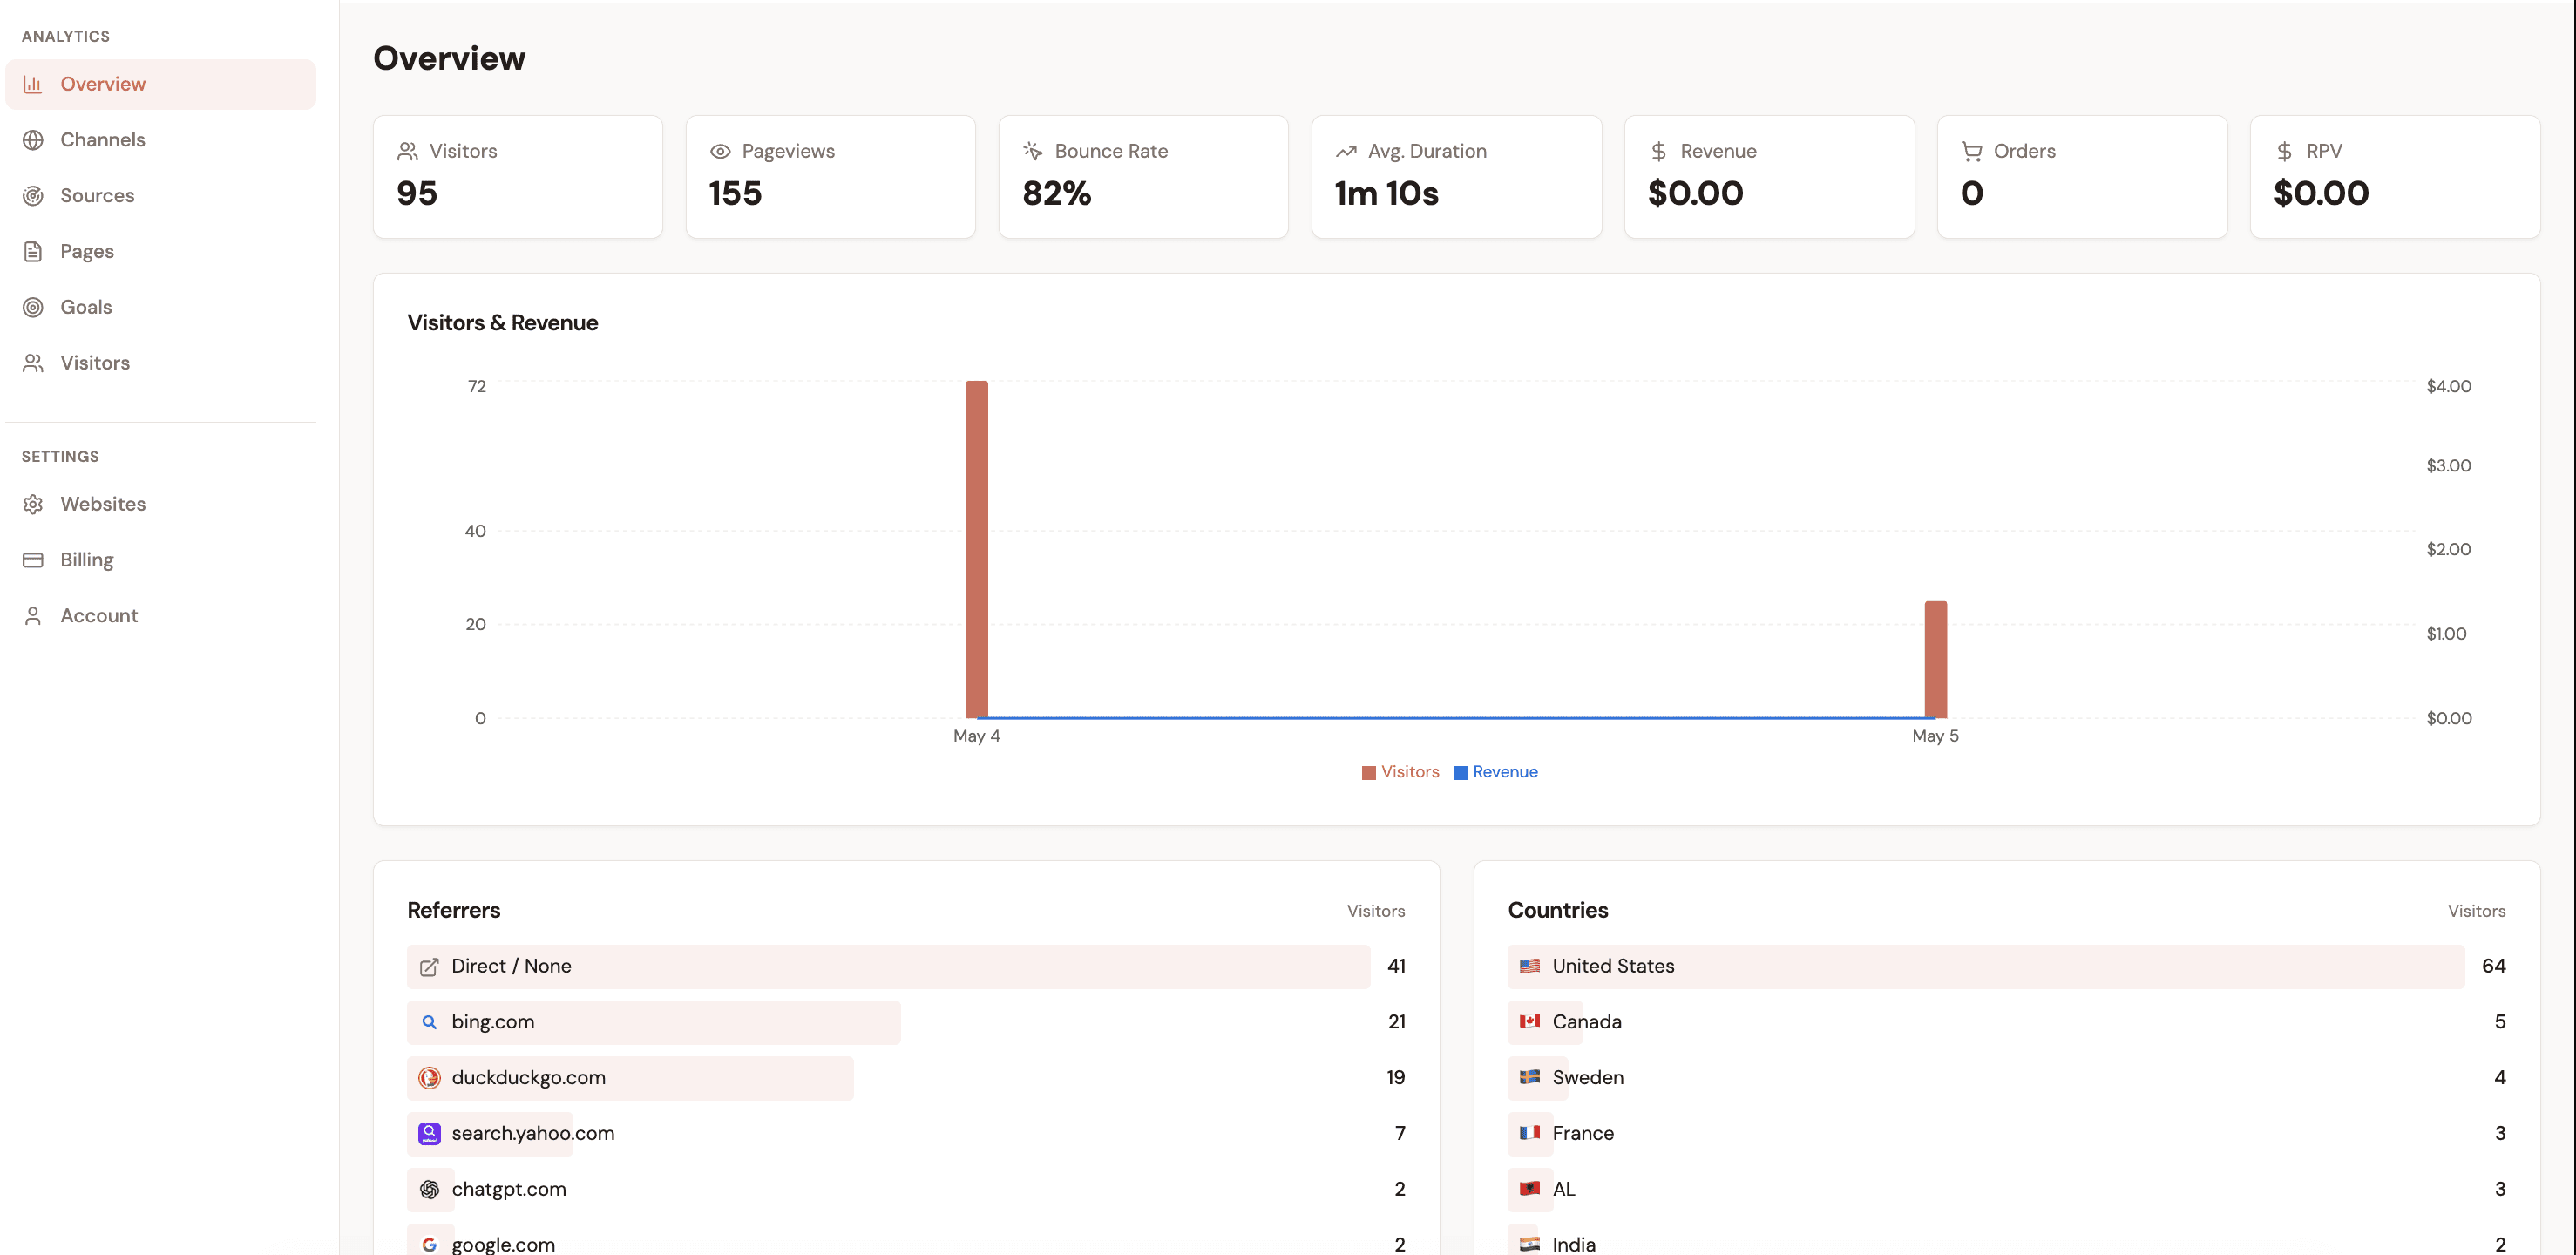
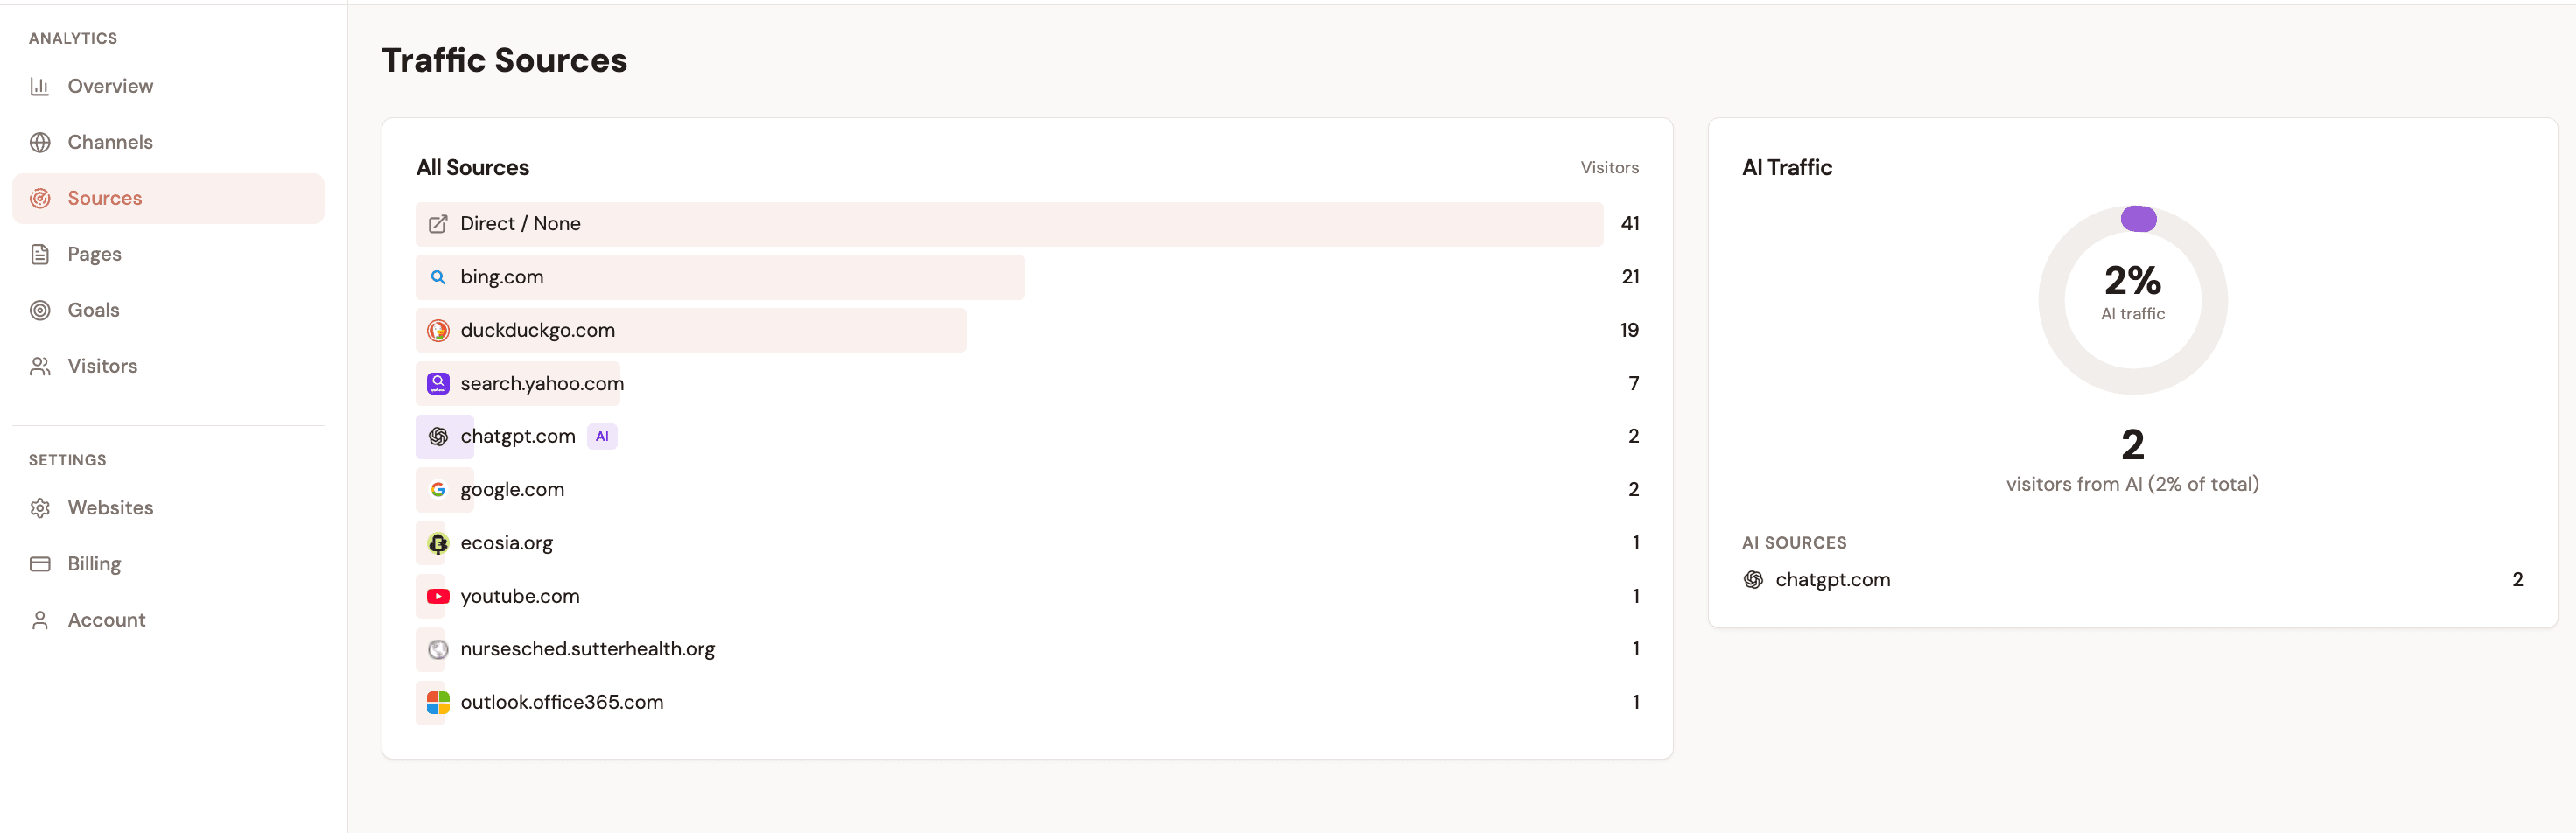
Updated March 2026 · 15 min read
TL;DR
  • SaaS revenue tracking is fundamentally different from ecommerce — you must attribute recurring renewals, upgrades, and churn back to the original acquisition channel.
  • The 7 metrics that matter by channel: MRR, ARR, ARPU, LTV, CAC, LTV:CAC ratio, and payback period. Blended versions are vanity metrics.
  • Baremetrics and ChartMogul show aggregate SaaS health. They cannot show MRR or LTV by marketing channel — you need an attribution layer for that.
  • Most common mistakes: tracking signups not revenue, ignoring expansion MRR, using last-touch for B2B sales cycles, and treating churn as channel-agnostic.
  • Setup takes 15 minutes: script tag on your site + Stripe OAuth connection + optional trial event. No webhooks, no BigQuery, no engineering.

Why SaaS revenue tracking is different from ecommerce

In ecommerce, a transaction is a discrete event. Someone clicks an ad, buys a product for $49, and that purchase is attributed to the ad. The relationship between acquisition channel and revenue is direct and immediate. One click, one payment, done.

SaaS revenue is a stream, not a spike. The customer who signs up for your $99/month plan today will (if you retain them) generate $1,188 in year one, $2,376 over two years, and so on. The marketing channel that acquired them deserves credit for all of that recurring revenue — not just the first payment. That fundamental difference makes SaaS revenue tracking significantly more complex.

Ecommerce revenue tracking
  • One-time transaction per customer
  • Attribution window: days to weeks
  • Revenue = transaction value
  • No trial periods to account for
  • No expansion revenue events
  • Churn is binary (bought or not)
SaaS revenue tracking
  • Recurring revenue across months and years
  • Attribution window: trial + lifetime
  • Revenue = ARPU × retention duration
  • Trial-to-paid conversion by channel
  • Expansion MRR from upgrades and seats
  • Churn rate varies by acquisition channel

This complexity is why most SaaS businesses operate with a significant blind spot: they know their aggregate MRR but cannot tell you which marketing channel generates the highest LTV customers, the lowest churn, or the fastest payback period. Without that data, budget decisions are based on traffic volume instead of revenue.

The revenue events you must track by channel

Trial signup

customer.subscription.created (status: trialing)

Measures top-of-funnel efficiency per channel. A channel with 100 trials beats one with 500 if it converts 40% vs 5%.

Trial-to-paid conversion

customer.subscription.updated (trialing → active)

The most important mid-funnel metric. Trial conversion rates by channel reveal product-channel fit. Some channels attract curious browsers; others attract buyers.

Subscription renewal

invoice.payment_succeeded (subscription_cycle)

Each renewal should be attributed to the original channel. This is how you calculate true LTV per channel over time.

Plan upgrade / expansion

customer.subscription.updated (price increase)

Expansion MRR attributed to original channel reveals which channels bring growth-oriented customers. Referral channels often over-index here.

Cancellation / churn

customer.subscription.deleted

Churn attributed back to channel shows which channels bring sticky customers and which bring churners who inflate trial numbers but drain MRR.

The 7 SaaS revenue metrics you must track by channel

These are not new metrics — every SaaS founder knows MRR and LTV. What most are missing is the channel dimension. Below is each metric with its formula, benchmark, and why the channel-level view changes everything about how you interpret it.

Benchmarks sourced from OpenView Partners SaaS Benchmarks 2024, ProfitWell Benchmarks, and First Page Sage CAC data.

MRRMonthly Recurring Revenue
Formula

Sum of all active subscription revenue in a calendar month

Benchmark

Track absolute value + month-over-month growth rate

Why track by channel

Which channels contribute to MRR growth vs. one-time revenue? Subscription customers from SEO often have lower churn than paid ads.

ARRAnnual Recurring Revenue
Formula

MRR × 12 (for monthly plans) or sum of all annual contracts

Benchmark

Seed-stage: $100K–$1M | Series A: $1M–$5M

Why track by channel

Channels that drive annual plan signups reduce churn risk. Email and referral often produce more annual subscribers than paid ads.

ARPUAverage Revenue Per User
Formula

MRR / Total Active Customers

Benchmark

Varies widely by product: $10–$500/mo for SMB SaaS

Why track by channel

Channels can attract very different customer tiers. LinkedIn often brings higher-ARPU enterprise buyers than Google organic.

LTVCustomer Lifetime Value
Formula

ARPU / Customer Churn Rate (monthly)

Benchmark

Healthy SaaS: LTV:CAC ratio of 3:1 or higher

Why track by channel

Referral customers typically have 20–30% higher LTV than paid search customers due to better product fit at acquisition.

CACCustomer Acquisition Cost
Formula

Total Channel Spend / New Paying Customers from That Channel

Benchmark

SaaS organic: $200–$940 | Paid search: $400–$900

Why track by channel

Blended CAC hides that one channel may cost $50/customer while another costs $900. Always calculate per channel.

LTV:CACLifetime Value to CAC Ratio
Formula

LTV / CAC

Benchmark

3:1 minimum | 5:1+ excellent | below 1:1 means losing money

Why track by channel

The single most actionable metric for budget allocation. A channel with 6:1 LTV:CAC deserves more investment before you add budget elsewhere.

Payback PeriodCAC Payback Period
Formula

CAC / (ARPU × Gross Margin)

Benchmark

Under 12 months: healthy | 12–18 months: acceptable | 18+ months: risky

Why track by channel

Paid channels often have short payback periods (cash out now, recover fast) while content/SEO has longer payback but higher LTV payoff.

The insight hiding in LTV by channel

LTV is highlighted above because it is where the most surprising data lives. Most SaaS teams find that referral customers have 25–40% higher LTV than paid search customers, and that organic search customers churn 30–50% less than social ad customers. Without channel-level LTV, you are optimizing for customer volume instead of customer value. A channel that drives 5 high-LTV customers for $50 each beats one that drives 25 low-LTV customers for $900 each — but blended metrics hide this completely.

The SaaS revenue tracking stack

Accurate SaaS revenue tracking requires three components working together. Most teams have the first two but are missing the third — which is why they see MRR in Stripe and traffic in analytics, but cannot connect the two.

1

Payment processor: Stripe

Source of truth for all revenue events

You already have this

Stripe captures every payment, subscription creation, renewal, upgrade, cancellation, and refund. It is authoritative on the revenue side. What it cannot do is tell you where those customers came from before they paid.

2

Web analytics: traffic source data

Source of truth for visitor acquisition

You probably have this

Google Analytics 4, Plausible, Fathom, or any analytics tool captures where visitors come from — UTM parameters, referrers, channel groups, landing pages. It knows traffic sources but not which visitors became paying Stripe customers.

3

Attribution layer: connecting sessions to payments

The missing link between traffic and revenue

Most teams are missing this

This is the component most SaaS teams are missing. An attribution layer captures traffic source at session start, persists that data through trials and return visits, and matches it to the Stripe payment server-side when the customer converts. Without this layer, Stripe and your analytics tool never talk to each other.

Why GA4 alone is not enough for SaaS

GA4 can track revenue events if you fire them manually via GTM or the Measurement Protocol — but it has three critical limitations for SaaS. First, browser-based tracking misses 30–40% of conversions due to ad blockers, consent rejections, and Safari ITP cookie deletion after 7 days (source: webkit.org). Second, subscription renewals happen server-side via Stripe webhooks with no browser involved — GA4 never sees them unless you build a custom Measurement Protocol integration. Third, the setup is complex: 4–8 hours of GTM configuration, data layer events, and BigQuery export to join session data with payment data. Most SaaS teams with fewer than 3 engineers cannot maintain this stack reliably.

How to attribute SaaS revenue to marketing channels

Revenue attribution for SaaS is not a single event — it is a sequence of measurements across the customer lifecycle. Here is how to approach each stage.

Stage 1

Trial signups by acquisition source

When a visitor starts a free trial, capture and store their traffic source at that moment. This is your trial attribution data. Every subsequent event for that customer — conversion, renewal, churn — references back to this original source.

What this reveals

If Google Ads drives 200 trials/month and LinkedIn drives 40, LinkedIn looks like an underperformer by volume. But if LinkedIn trials convert to paid at 35% and Google Ads trials convert at 6%, LinkedIn generates 14 paying customers vs. 12 from Google Ads — at a fraction of the ad spend. Volume without conversion rate is meaningless.

Stage 2

Trial-to-paid conversion rate by channel

Track the percentage of trials from each channel that become paying subscribers. This is one of the most differentiated metrics in SaaS attribution — conversion rates routinely vary 5x to 10x between channels, because channel affects who you attract, not just how many you attract.

Referral
32%
Strong intent, pre-qualified by peer recommendation
Organic Search
18%
Research intent, seeking a solution to a specific problem
Google Ads
7%
Mixed intent — captures browsers and buyers equally

Example data only — your actual rates will differ. The pattern (referral outperforms paid) is consistent across most SaaS businesses.

Stage 3

Expansion revenue by original acquisition source

When a customer upgrades their plan, adds seats, or purchases an add-on, that expansion MRR should be attributed to the channel that originally acquired them. This is where the long-term channel value becomes visible. Some channels bring customers who buy the entry plan and stay there. Others bring customers who grow into high-value accounts.

According to OpenView Partners' 2024 SaaS benchmark report, companies with net revenue retention above 120% generate 40% of their MRR growth from existing customers. If you are not attributing expansion revenue to original channels, you are measuring less than half of each channel's real contribution.

Stage 4

Churn rate by acquisition channel

When a subscription cancels, attribute the churn to the original acquisition channel. Over time, this reveals your channel churn map — the single most underused dataset in SaaS marketing analytics. A channel with a 2% monthly churn rate produces customers with an average tenure of 50 months. A channel with 7% monthly churn produces customers who stay 14 months. For a $99/month plan, that is the difference between $4,950 and $1,386 in LTV — a 3.6x gap from the same product at the same price.

SaaS revenue analytics by channel: what the data looks like

Here is a realistic example of a SaaS business with $18,900 in monthly MRR across five marketing channels. The numbers reveal the counterintuitive insights that only channel-level attribution can surface.

Google Organic (SEO)
MRR

$6,840

Customers

38

LTV

$2,160

CAC

$310

LTV:CAC

7.0x

Monthly Churn

3.1%

Referral / Word of Mouth
MRR

$4,500

Customers

20

LTV

$3,214

CAC

$45

LTV:CAC

71.0x

Monthly Churn

2.1%

Newsletter / Email
MRR

$3,600

Customers

18

LTV

$2,857

CAC

$90

LTV:CAC

32.0x

Monthly Churn

2.8%

Google Ads
MRR

$2,880

Customers

16

LTV

$1,440

CAC

$520

LTV:CAC

2.8x

Monthly Churn

6.3%

LinkedIn Organic
MRR

$1,080

Customers

4

LTV

$2,700

CAC

$180

LTV:CAC

15.0x

Monthly Churn

3.3%

What this data tells you to do

  • Referral (71:1 LTV:CAC): Massively underinvested. Build a formal referral program immediately. Every dollar spent on incentivizing referrals has by far the highest return.
  • Newsletter (32:1 LTV:CAC): Invest in content and email list growth. These customers have 2.8% monthly churn vs. 6.3% for Google Ads — they are twice as sticky.
  • Google Ads (2.8:1 LTV:CAC): Below the healthy 3:1 threshold. Optimize targeting and landing pages before scaling. The 6.3% churn rate is the root cause — better qualification at acquisition would fix both metrics simultaneously.

The insight you cannot get from Baremetrics or ChartMogul

Baremetrics and ChartMogul would show you that your overall LTV:CAC is approximately 8:1 and your blended churn is 3.5%. Those look like excellent numbers. You would have no reason to question your Google Ads spend. The channel-level view reveals that Google Ads is the weakest performer by every metric — and that reallocating even a portion of that budget to referral programs and newsletter growth would dramatically improve business health within one quarter.

6 SaaS revenue tracking mistakes that distort your data

Getting these wrong does not just leave gaps in your data — it actively misleads your budget decisions. These are the most common errors in SaaS revenue analytics, ranked by how often they show up and how much damage they cause.

1

Tracking signups instead of revenue

Trial signup counts per channel look impressive but hide massive variation in downstream revenue. A channel that drives 200 signups with a 4% trial-to-paid rate produces 8 customers. Another channel that drives 40 signups with a 30% conversion rate produces 12. Optimize for revenue events, not sign-up events.

2

Ignoring expansion revenue

Expansion MRR — revenue from plan upgrades, seat additions, and add-ons — often accounts for 20–40% of total MRR growth for healthy SaaS businesses (source: OpenView Partners, 2024). If you only track initial subscriptions per channel, you are missing a significant portion of channel value. Channels that attract customers who upgrade deserve more credit and more budget.

3

Using last-touch for long B2B sales cycles

A B2B SaaS customer might discover you through a podcast mention, read a comparison blog, watch a demo, and sign up 45 days later via direct navigation. Last-touch gives 100% credit to "Direct." First-touch attribution gives credit to the podcast — the channel that started the journey. For sales cycles longer than 7 days, first-touch or linear attribution is almost always more accurate.

4

Not accounting for free trial periods

If your trial is 14 days long, the customer who converts 14 days after clicking a Google Ad looks like a "direct" conversion in most analytics tools that measure sessions daily. Your attribution window must extend beyond the trial period — or you will systematically misattribute trial conversions.

5

Treating churn as channel-agnostic

Churn rates vary significantly by acquisition channel. Customers from paid ads often churn 2–3x faster than customers from organic search or referral, because intent and product fit at acquisition differs. If you calculate LTV using a blended churn rate, every channel looks equally valuable. Track churn by original acquisition channel to find which channels bring loyal customers.

6

Only attributing to the paying customer, not the account

In B2B SaaS with team accounts, the person who signs up is often not the person who was originally acquired by marketing. A team member shares an invite link, the colleague signs up directly. The payment looks like "Direct" even though it originated from a LinkedIn ad that the original user clicked. Account-level attribution is essential for accurate B2B revenue tracking.

SaaS revenue tracking tools compared (2026)

There are two categories of tools relevant to SaaS revenue tracking: SaaS metrics dashboards (Baremetrics, ChartMogul, ProfitWell) and marketing attribution tools (Attrifast). They answer different questions — and most SaaS teams are missing the second category entirely.

The table below evaluates each tool on whether it can break down revenue metrics by the specific marketing channel that acquired each customer.

Attrifast

Free – $29/mo

Recommended
MRR by channel

LTV by channel

Trial conv. by channel

Setup time

2 minutes

Baremetrics

From $108/mo

MRR by channel

LTV by channel

Trial conv. by channel

Setup time

30 minutes

ChartMogul

Free – $100/mo

MRR by channel

LTV by channel

Trial conv. by channel

Setup time

30–60 minutes

ProfitWell

Free

MRR by channel

LTV by channel

Trial conv. by channel

Setup time

15–30 minutes

GA4

Free

MRR by channel

Partial

LTV by channel

Trial conv. by channel

Partial

Setup time

4–8 hours

Why Baremetrics and ChartMogul cannot show revenue by channel

Baremetrics and ChartMogul connect to Stripe and build excellent SaaS metrics dashboards. They see all your subscription events: MRR, ARR, churn, LTV, and cohort analysis. What they cannot see is how each customer was originally acquired, because that data lives in your website sessions — not in Stripe. Without a layer that connects browser sessions to Stripe customers at the moment of acquisition, neither tool can segment any metric by marketing channel. They are reporting on your business health in aggregate. Attrifast adds the acquisition dimension that makes every metric actionable for marketing decisions.

Step-by-step: set up SaaS revenue tracking in 15 minutes

This walkthrough covers the complete setup with Stripe and Attrifast. No engineering team needed. No BigQuery. No webhook infrastructure to build or maintain.

1

Add the Attrifast tracking script

Paste a single 4KB script tag into your site's <head>. Works with React, Next.js, Webflow, WordPress, and plain HTML. The script captures traffic source, UTM parameters, referrer, and landing page for every visitor — without cookies.

<!-- Add before closing </head> -->
<script
  defer
  data-tracking-id="your-tracking-id"
  src="https://api.attrifast.com/af.js"
></script>
2

Connect Stripe via OAuth

Go to Settings → Integrations → Stripe and click Connect. Attrifast gets read-only access to your payment events via Stripe OAuth. No API keys. No webhook URLs to configure. Works for both one-time charges and subscriptions.

3

Tag your trial signup flow (optional but recommended)

If you offer a free trial, fire a custom event when someone starts a trial. This lets Attrifast track trial-to-paid conversion rates by channel — not just final payment attribution.

// Fire when a trial starts
window.attrifast?.track('trial_started', {
  plan: 'pro',
  trial_days: 14,
});
4

View MRR and LTV by channel in your dashboard

Within minutes of the first payment, your Channels view shows MRR, total revenue, customer count, ARPU, and LTV broken down by the marketing channel that originally brought each customer. Expansion revenue and renewals are automatically attributed to the original acquisition source.

5

Set up MRR movement alerts (optional)

Configure weekly email digests or Slack notifications when a channel's MRR contribution drops by more than 10%. Early churn detection by channel lets you investigate before it compounds.

What you see after setup

Within hours of the first paying conversion, your Channels dashboard shows MRR broken down by acquisition source, with trial conversion rates, customer counts, ARPU, and LTV per channel. Renewal payments are automatically attributed to the original channel without any additional configuration. As more payment events flow in over weeks and months, the LTV and payback period columns become increasingly accurate reflections of each channel's real contribution to your business.

Cookie-free by design

Attrifast does not use cookies or fingerprinting. Session matching is done server-side using a privacy-preserving identifier that does not require consent under GDPR or CCPA. No consent banner needed. No data lost to consent rejections. This is why server-side attribution captures 30–40% more conversions than cookie-based tools like GA4 in privacy-sensitive markets. For more on the technical approach, see the Traffic Attribution Guide.

Key takeaways

1SaaS revenue tracking is fundamentally different from ecommerce. Every renewal, upgrade, and cancellation must be attributed back to the original acquisition channel to calculate true LTV and payback period per channel.
2The 7 metrics that matter by channel: MRR, ARR, ARPU, LTV, CAC, LTV:CAC ratio, and payback period. Blended versions of all these are vanity metrics for marketing decisions.
3Baremetrics, ChartMogul, and ProfitWell are excellent SaaS health dashboards but cannot show any metric broken down by marketing channel — they have no access to acquisition data.
4The most common and damaging mistake is tracking trial signups per channel instead of revenue. A channel with 5x the trials can generate fewer paying customers at 3x the CAC.
5Churn rate by acquisition channel is the most underused insight in SaaS analytics. A 2% monthly churn channel produces 3.6x more LTV than a 7% monthly churn channel at the same ARPU.
6Setup takes 15 minutes: script tag + Stripe OAuth. No webhooks, no BigQuery, no engineering. The entire attribution stack runs server-side, capturing events that browser-based tools miss entirely.

Frequently asked questions

What is SaaS revenue tracking?

SaaS revenue tracking is the practice of measuring recurring revenue metrics — MRR, ARR, LTV, churn, and expansion revenue — and connecting them to the specific marketing channels that acquired each customer. Unlike ecommerce revenue tracking (one transaction per customer), SaaS revenue tracking must account for subscription lifecycle events: renewals, upgrades, downgrades, and cancellations, all attributed to the original acquisition source.

How do I track MRR by marketing channel?

To track MRR by marketing channel, you need an attribution layer between your website and your payment processor (typically Stripe). When a visitor arrives on your site, capture their traffic source (UTM, referrer, or channel). When they subscribe, match the Stripe subscription to that visitor session server-side. All subsequent renewal payments are then attributed to the same original channel, giving you a true MRR-by-channel breakdown. Tools like Attrifast do this automatically in 2 minutes.

What is a good LTV:CAC ratio for SaaS?

A healthy SaaS LTV:CAC ratio is 3:1 or higher — meaning for every $1 you spend acquiring a customer, you generate $3 or more in lifetime revenue. Ratios below 1:1 mean you are losing money on customer acquisition. Above 5:1 often signals that you are under-investing and should scale spend. The most valuable insight is LTV:CAC by channel, not blended, because individual channels can range from 0.5:1 to 70:1 within the same business.

Does Stripe track which marketing channel drove a subscription?

No. Stripe is a payment processor with no visibility into browser sessions, referrers, or UTM parameters. It processes payments server-side and records the payment amount, timestamp, and customer data — but has no concept of marketing source. You need a separate attribution tool to connect the Stripe subscription to the marketing channel that originally brought the customer.

How is SaaS revenue tracking different from ecommerce revenue tracking?

Ecommerce tracks one-time transactions: a single purchase event attributed to a single channel. SaaS revenue tracking is fundamentally more complex because a single customer may generate revenue across 12, 24, or 60+ months of renewals. Each renewal should be attributed back to the original acquisition channel. SaaS also involves trial periods (where the attribution window must extend past the trial), plan upgrades (expansion revenue), and involuntary churn from failed payments — all of which need accurate channel attribution to build a true picture of channel LTV.

What is the difference between Attrifast and Baremetrics or ChartMogul for SaaS revenue tracking?

Baremetrics and ChartMogul are SaaS analytics tools that connect to Stripe and show aggregate metrics: total MRR, churn rate, ARPU, and cohort analysis. They are excellent for understanding your overall business health. What they cannot do is break those metrics down by marketing channel — because they have no visibility into how each customer was originally acquired. Attrifast fills that gap by connecting your website traffic sources to Stripe revenue events, so you see MRR, LTV, churn rate, and payback period segmented by the specific channel that brought each customer.

LTV:CAC ratio benchmarks for SaaS — 2026 cross-industry

Source: First Page Sage 2025 LTV:CAC ratio benchmark; OpenView SaaS Benchmarks; Pavilion 2024

See your MRR and LTV by marketing channel

Attrifast connects Stripe to your marketing channels automatically — showing MRR, LTV, churn rate, and payback period by acquisition source. Cookie-free. 2-minute setup.

Start tracking SaaS revenue →

Loved by 500+ users